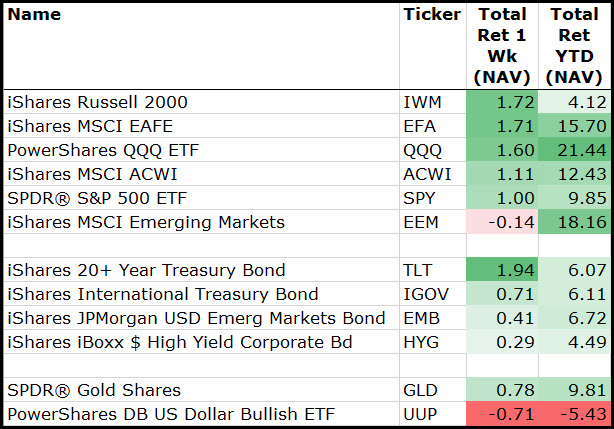
The financial markets continued to absorb major news events with surprising ease last week. Be it the tragedies in the U.K., the withdrawal from the Paris climate agreement, or the weakness in Friday’s employment data, the stock and bond markets both continued to edge higher. Investors seem to have become conditioned toward individual isolated disappointments all while the bigger picture is toward one of global economic growth and relative stability.
But as we have mentioned many times before this year, the markets are differentiating themselves under the surface. While the S&P 500 is up 9.5% in 2017, the Nasdaq 100 is up 21%. And while the all-world iShares MSCI ACWI (NASDAQ:ACWI) is +12% YTD, Spain is +26%. To the downside, the Energy sector is -13%. So, active investors do not have excuses in 2017. The environment for uncorrelated returns is very good and it is time to put up numbers.
The year-to-date economic and political backdrops seem like they could easily continue into the fourth quarter of 2017. With little getting done in Washington D.C., the US dollar should continue to weaken providing for better returns in overseas assets or in companies that generate much of their revenues in foreign currencies. Valuations for equities, as well as relative growth, seem to favor foreign stocks. So, I’d expect the flows into international funds to continue. If you are forced to invest in the U.S., stay growth oriented and/or in multinationals that can benefit from improving foreign growth. The road ahead looks easy, but keep your hands on the wheel because the bumps will always try and throw you off.
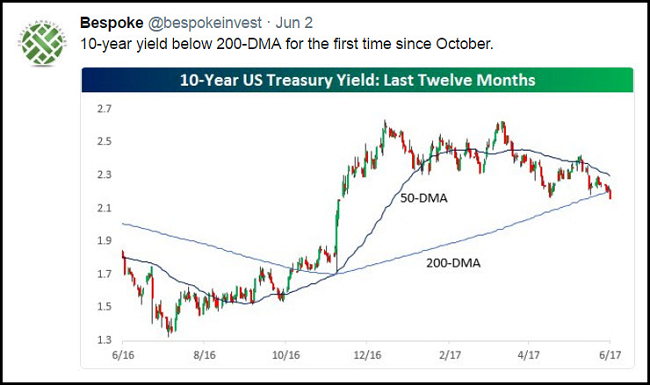
The May jobs data was weaker than expected and the bond market did not waste time in letting everyone know…
The 10-year bond yield broke decisively below its 200-day moving average for the first time in 8 months.
For the week, the developed equity and bond markets did very well while the U.S. dollar suffered…
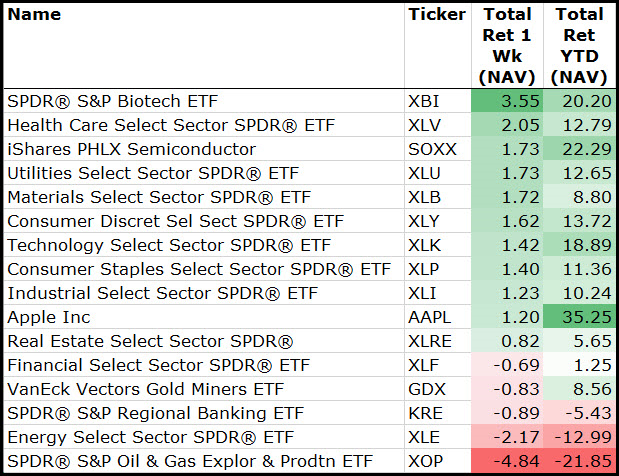
Among sectors last week, growth stocks dominated while Energy and Financials continued to flail…
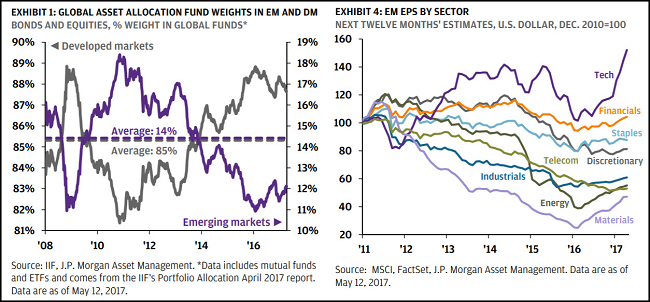
If you are underweight international equities, read this weekend piece from J.P. Morgan…
From 2011 to early 2016, EM economic growth, earnings and returns were under pressure. The headwinds for EM were significant, and included collapsing commodity prices (first for industrial metals and then energy), rapidly depreciating currencies and uncertainty surrounding economic growth in China. Investing in EM began to be thought of as merely a reach for yield, and expectations were that EM asset classes would continue to disappoint. Over time, investors significantly pared down their exposures to EM assets, notably in local currency-denominated fixed income and equities. In January of 2016, EM fixed income and equities together represented only 10.9% of global allocation, compared to an average of 14.4% since 2008 (Exhibit 1). Since early 2016, investors have been slowly adding back exposure, but remain underweight EM, especially on the equity side.
By maintaining limited exposure to EM, investors are missing out on the brightening outlook for EM economies and companies. External conditions are very different than they were 11 months ago; the dark clouds hanging over the asset class are now beginning to dissipate. Since the lows of January 21, 2016, EM returns have been sizable: equities have risen 47.8%, U.S. dollar sovereign debt is up 18.2% and local currency sovereign debt is up 16.7%. Crucially, the improving external backdrop and accelerating growth picture suggest that this is not a temporary bounce.
“Conservatively, Argentina will represent about half of global lithium (NYSE:LIT) production by 2020,” Meilan, who also headed up mining under former President Carlos Menem in the 1990s, said from Toronto, where he’s participating in the PDAC mining conference. “This shows us that we’re starting to be well-regarded globally.”
International Equity Funds continue to consistently gather assets which can only help future returns…
@ReformedBroker: Investors rediscover international – US stock ETFs had outflows in May, Global stock ETFs raised over $20 billion! via @StateStreet

If you can’t invest in foreign stocks, then look at the outperformance that you can get from a basket of U.S. multinational stocks (right chart)…
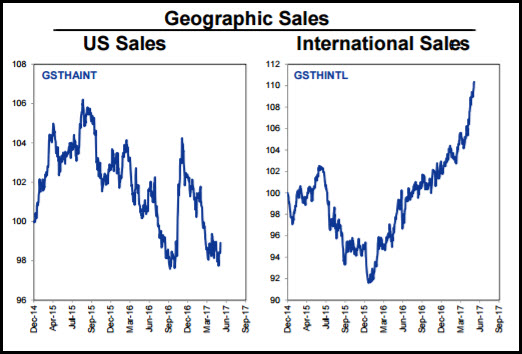
((NYSE:Goldman Sachs))
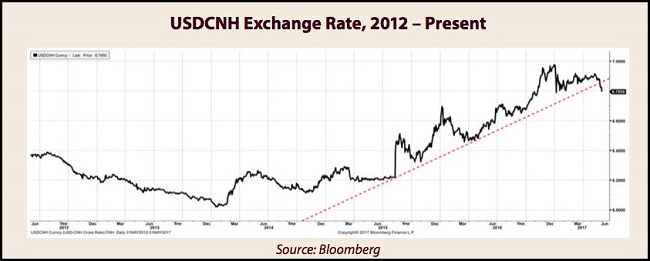
An interesting chart of the Chinese Yuan showing a two-year trendline break. Another reason to get interested in Chinese and Emerging Market stocks?
@WhatILearnedTW: USDCNH exchange rate has broken below a key upward trendline that began 8/11/15, when PBOC unexpectedly initiated a sharp yuan devaluation
The broader basket of EM currencies is also recently outperforming the U.S. dollar…
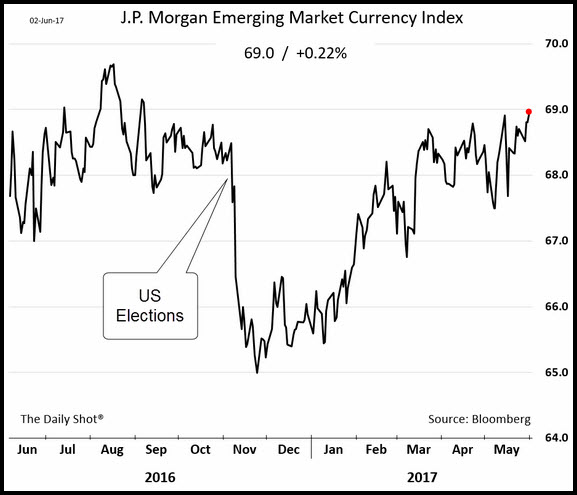
(WSJ/Daily Shot)
Global stock pickers are licking their chops as equity correlations fall toward 12-year lows…
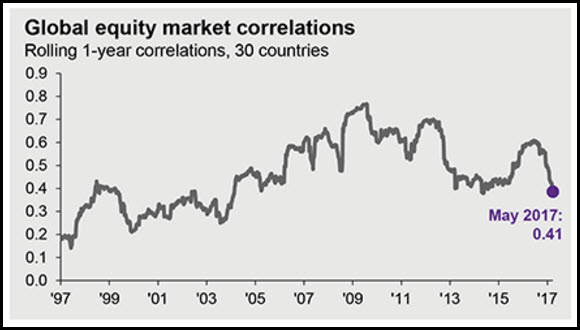
And Goldman is excited as active portfolio managers look set to put up relative outperformance…
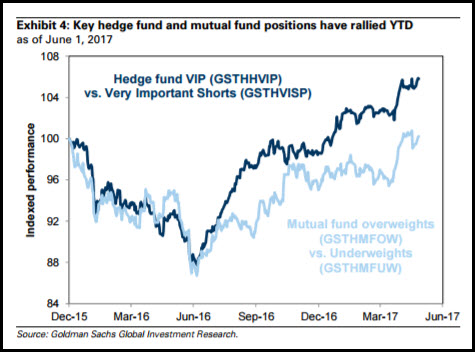
Alpha generation from bottom-up stock picking is the story of 2017! Our baskets of popular hedge fund and mutual fund long positions have both outperformed YTD and during the last 12 months (Exhibit 4). Hedge fund popular long positions have outperformed a corresponding basket of hedge fund short positions by 702 bp YTD (13% vs 6%). Similarly, our mutual fund overweight basket has outperformed our mutual fund underweight basket by 558 bp during the same period (12% vs 7%).
(Goldman Sachs (NYSE:GS))
A good sign of a healthy market is a strong M&A environment. And so, Citi has become more concerned about the U.S…
“In some respects, one of the scariest charts to look at currently is the number of announced mergers & acquisition deals over the past year or two,” Tobias Levkovich, the chief US equity strategist at Citi, said in a note on Friday.
“M&A lawyers argue the ‘uncertainty’ factor, which has come about recently, given some unpredictable aspects of the new Trump administration, has been the issue. It only may explain the last six months, but the trend has been poor for about two years or more. In the past, there has been some correlation with the S&P 500 and thus it could generate more legitimate fears than some of the other excuses that are put forth for not wanting to buy American equities.”
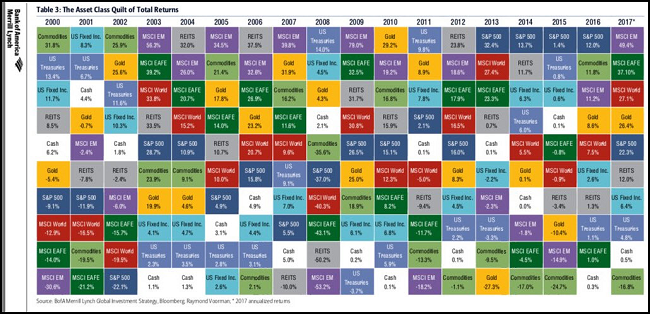
Speaking of the U.S. Equity market, did anyone really think it could outperform the major asset classes for a 5th year in a row?
@DavidSchawel: Crazy that S&P 500 was the top one four years in a row
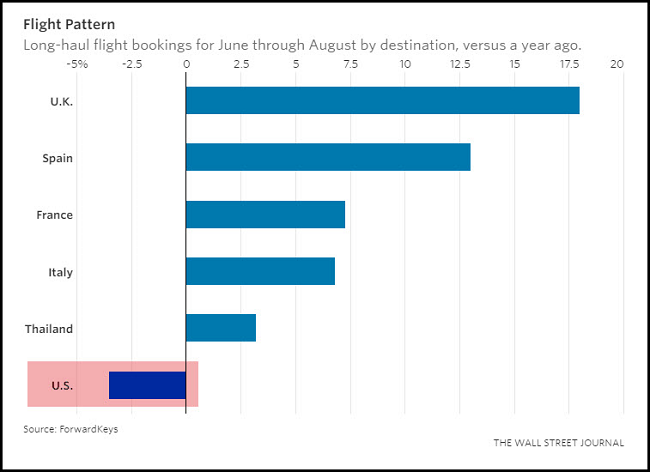
The 2017 data continues to be stacked against U.S. travel destinations that rely on foreign travelers…
New York City tourism officials are forecasting the first drop-off in foreign visitors this year since the financial crisis. Foreigners account for half of tourism spending even though they amount to just a fifth of tourists to New York, city officials say.
That could hurt some real-estate investment trusts that are heavily exposed to New York hotels. Hersha Hospitality Trust , DiamondRock Hospitality, Host Hotels and Resorts and LaSalle Hotel Properties have the highest exposure to the city, according to Rich Hightower, an analyst with Evercore ISI. Retailers such as jeweler Tiffany, which gets a significant percentage of annual sales from its flagship store on New York’s tourist-trafficked Fifth Avenue, could also feel the pain.
Intel (NASDAQ:INTC) has a REALLY big market for you to spend research time on…
The race to be the first to deploy autonomous vehicles is on among carmakers, emerging startups, and tech giants. Amid this constant news cycle of deals and drama, the purpose of all of it can get lost — or at least a bit muddied. What exactly are these companies racing for?
A $7 trillion annual revenue stream, according to a study released Thursday by Intel. The companies that don’t prepare for self-driving risk failure or extinction, Intel says. The report also finds that over half a million lives could be saved by self-driving over just one decade.
The study, prepared by Strategy Analytics, predicts autonomous vehicles will create a massive economic opportunity that will scale from $800 billion in 2035 (the base year of the study) to $7 trillion by 2050. An estimated 585,000 lives could be saved due to autonomous vehicles between 2035 and 2045, the study predicts.
If you love ‘Thing Explainer’, then Merrill Lynch has built a chart for you…
@valuedelay: interesting BAML primer on housing today for us generalists

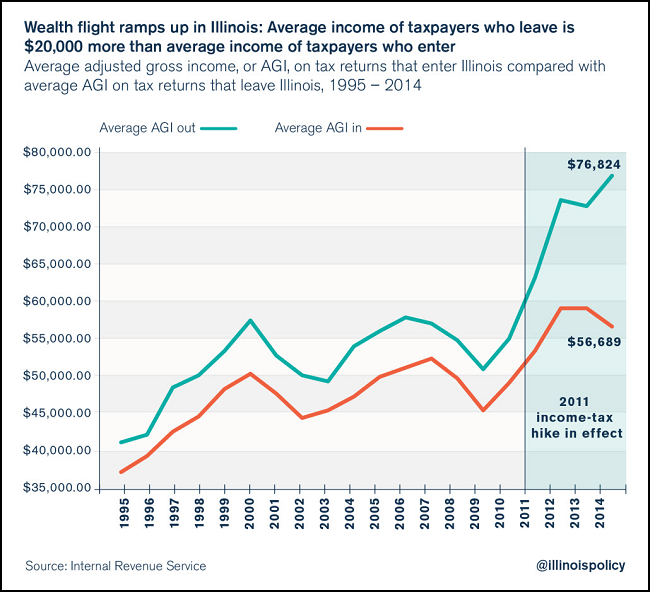
S&P downgraded Illinois to near junk status last week. I wonder if this chart factored into their decision to keep Illinois on the negative watchlist?
The best Father’s Day, Graduation, Birthday or Lengthen-Your-Lifespan gift ever…
I asked my wife for a year not to buy me a Peloton bike because I like to ride outside. But after she flouted my wishes and put one in the garage, I am now convinced that it is easily the most efficient form of exercise that I have ever participated in. I don’t have to worry about the outdoor weather, the inefficiency of driving to a club, or running my joints into the ground. Now I just put on my shoes and shorts and burn 1,000 calories an hour while being pushed by a motivating trainer with great music. If you don’t want to spend the dollars on a bike, then go find one in a Westin Hotel or get one added to your commercial gym.
- Peloton, the indoor-fitness company, has raised $325 million from investors including Wellington Management, Fidelity Investments, Kleiner Perkins, and Comcast (NASDAQ:CMCSA) NBCUniversal.
- The deal, likely to be the last financing round before the company goes public, was put together by a number of cycling enthusiasts.
- The company is on a steep-growth curve: It has tripled annual revenue, to $170 million, in just a year, and has 100,000 paying subscribers.
Peloton Cycle is built around indoor cycling from the home. It has 22 showrooms around the country, and two studios — a flagship in Manhattan and a studio in Chicago. Customers can choose from a variety of live classes and archived classes. The bike costs $1,995, and unlimited classes cost $39 a month…
The company is vertically integrated, making its own hardware, producing a tablet computer and the bike it sits on, and software, with 75 software engineers in New York City. It produces 12 hours of live television content a day, and sells through its own retail stores. It also delivers its own bikes in some cities.
“Peloton is a cultural phenomenon and has redefined what it means to build a connected experience disrupting multiple industries simultaneously: in home fitness, boutique class fitness and connected media devices,” said Jon Callaghan, cofounder of True Ventures, another investor in the firm.
One more thing, I’m surprised Amazon (NASDAQ:AMZN) hasn’t purchased Peloton yet…
- My Peloton use replaces Amazon/Audible revenues because I am no longer listening to a book on my rides or reading a book on my treadmill.
- Peloton workout playlists and music could be easily shifted to Amazon where they can be better monetized over the Peloton hardware.
- Amazon Prime membership has 60m users. Find a way to gather users via your customer base that is already addicted to you.
- Could be a big data move into the health market? Let me put my health info up into the cloud and then sync it with all of my workout data. Share it with my doctor and then cut my healthcare insurance in half.
- It rains a lot in Seattle. Easier and safer to burn calories indoors than on those wet Seattle hills.
Finally, a great story that is about a watch…
“If Paul were alive, and I went to him and said, ‘Hey, you know that watch you gave me years ago? Turns out it’s super iconic and valuable,’ ” says James. “I think his response would be, ‘Well, what are you going to do with it, kid?’ ”
The original Paul Newman Daytona goes on sale on October 26 at the first-ever Phillips watch auction in New York. Phillips expects bidding to exceed $1 million, and the Nell Newman Foundation will receive a significant portion of the proceeds.
“Pop would give you the shirt off his back,” says Nell, who believes her father most likely approached James at the treehouse intending to give him the watch. “This is following in that tradition of generosity. I think this is the best purpose for the watch.”
The information presented here is for informational purposes only, and this document is not to be construed as an offer to sell, or the solicitation of an offer to buy, securities. Some investments are not suitable for all investors, and there can be no assurance that any investment strategy will be successful. The hyperlinks included in this message provide direct access to other Internet resources, including Web sites. While we believe this information to be from reliable sources, 361 Capital is not responsible for the accuracy or content of information contained in these sites. Although we make every effort to ensure these links are accurate, up to date and relevant, we cannot take responsibility for pages maintained by external providers. The views expressed by these external providers on their own Web pages or on external sites they link to are not necessarily those of 361 Capital.
