Bitcoin price today: slips below $88k as rebound stalls ahead of key US data
Analysis for an alternative scenario to trade Bitcoin. Let’s monitor the market sentiment and try to predict the big traders actions.In this post, I applied the following tools: fundamental analysis, all-round market view, graphic analysis, market balance level, oscillators, volume profile, key levels, trendline analysis, market sentiment analysis.
After the yesterday’s BTC/USD surge, I can’t but analyze the recent changes in the crypto market sentiment and update the current scenario.
First, I’ll a kind of show off a little, as early as at 4.35 GMT on July 12, I was one of the first to tell my subscribers about and emerging Head and Shoulders pattern in Bitcoin price chart.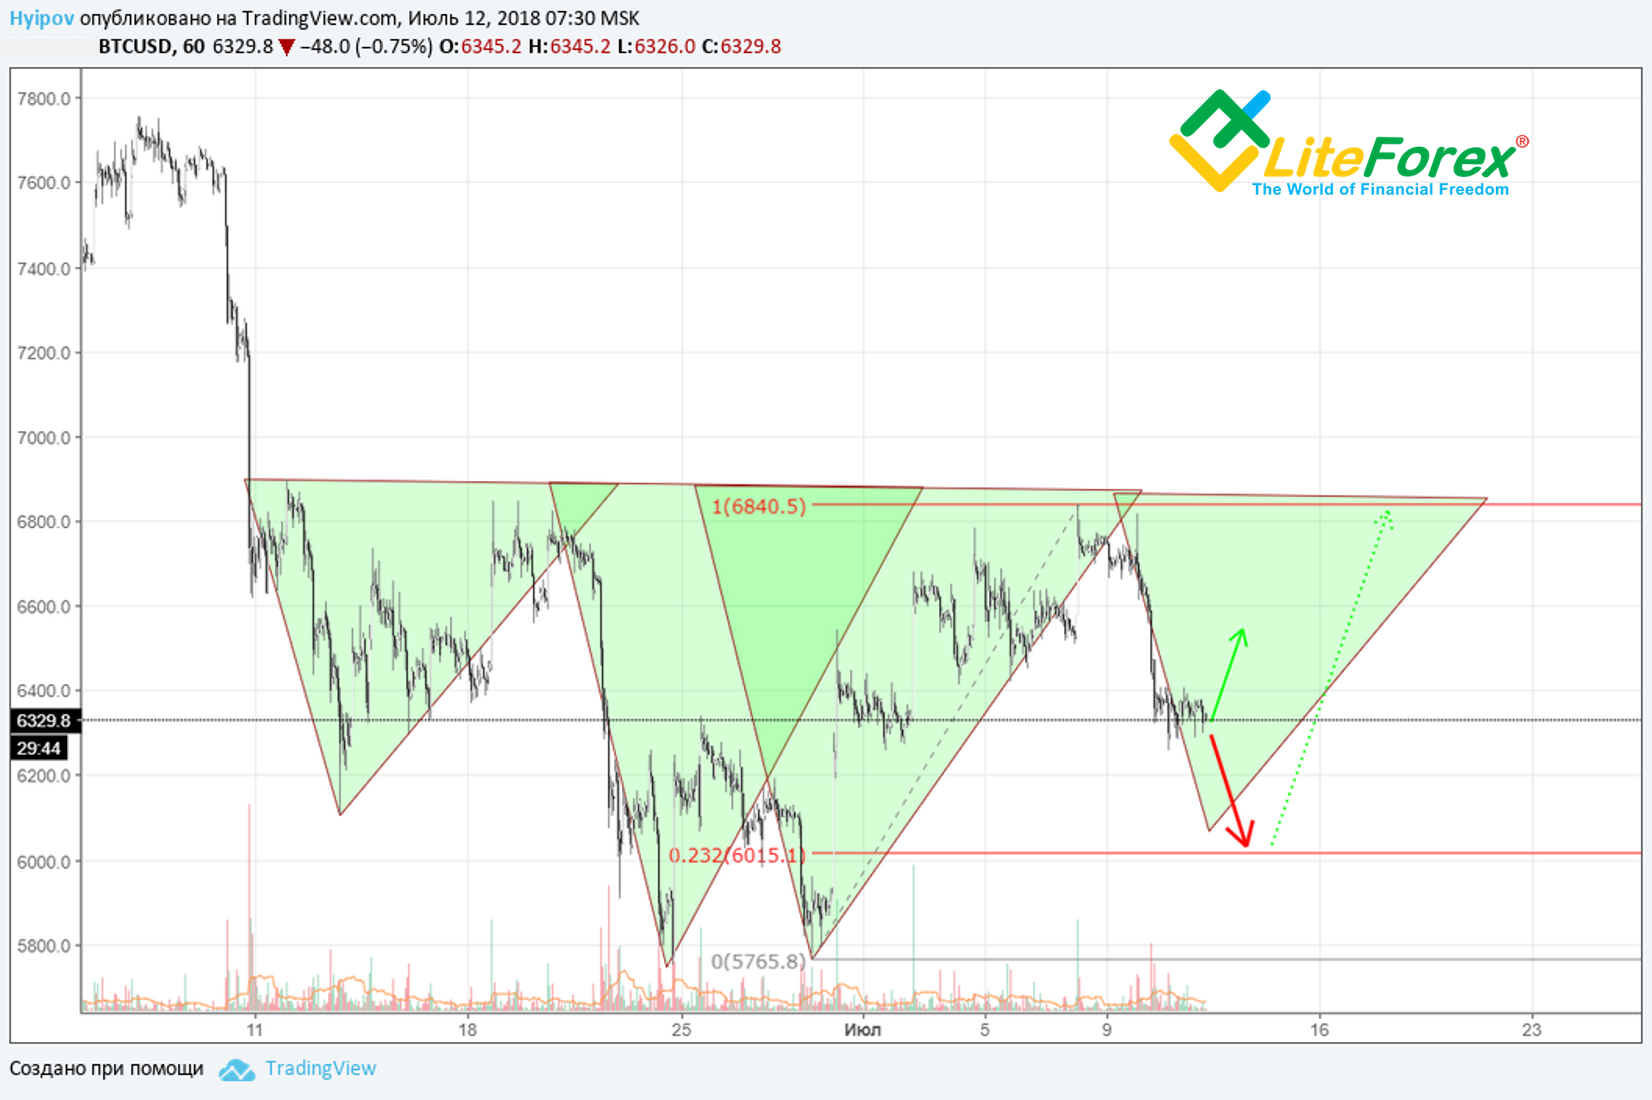

Currently, we all see that this S-H-S formation has been almost complete.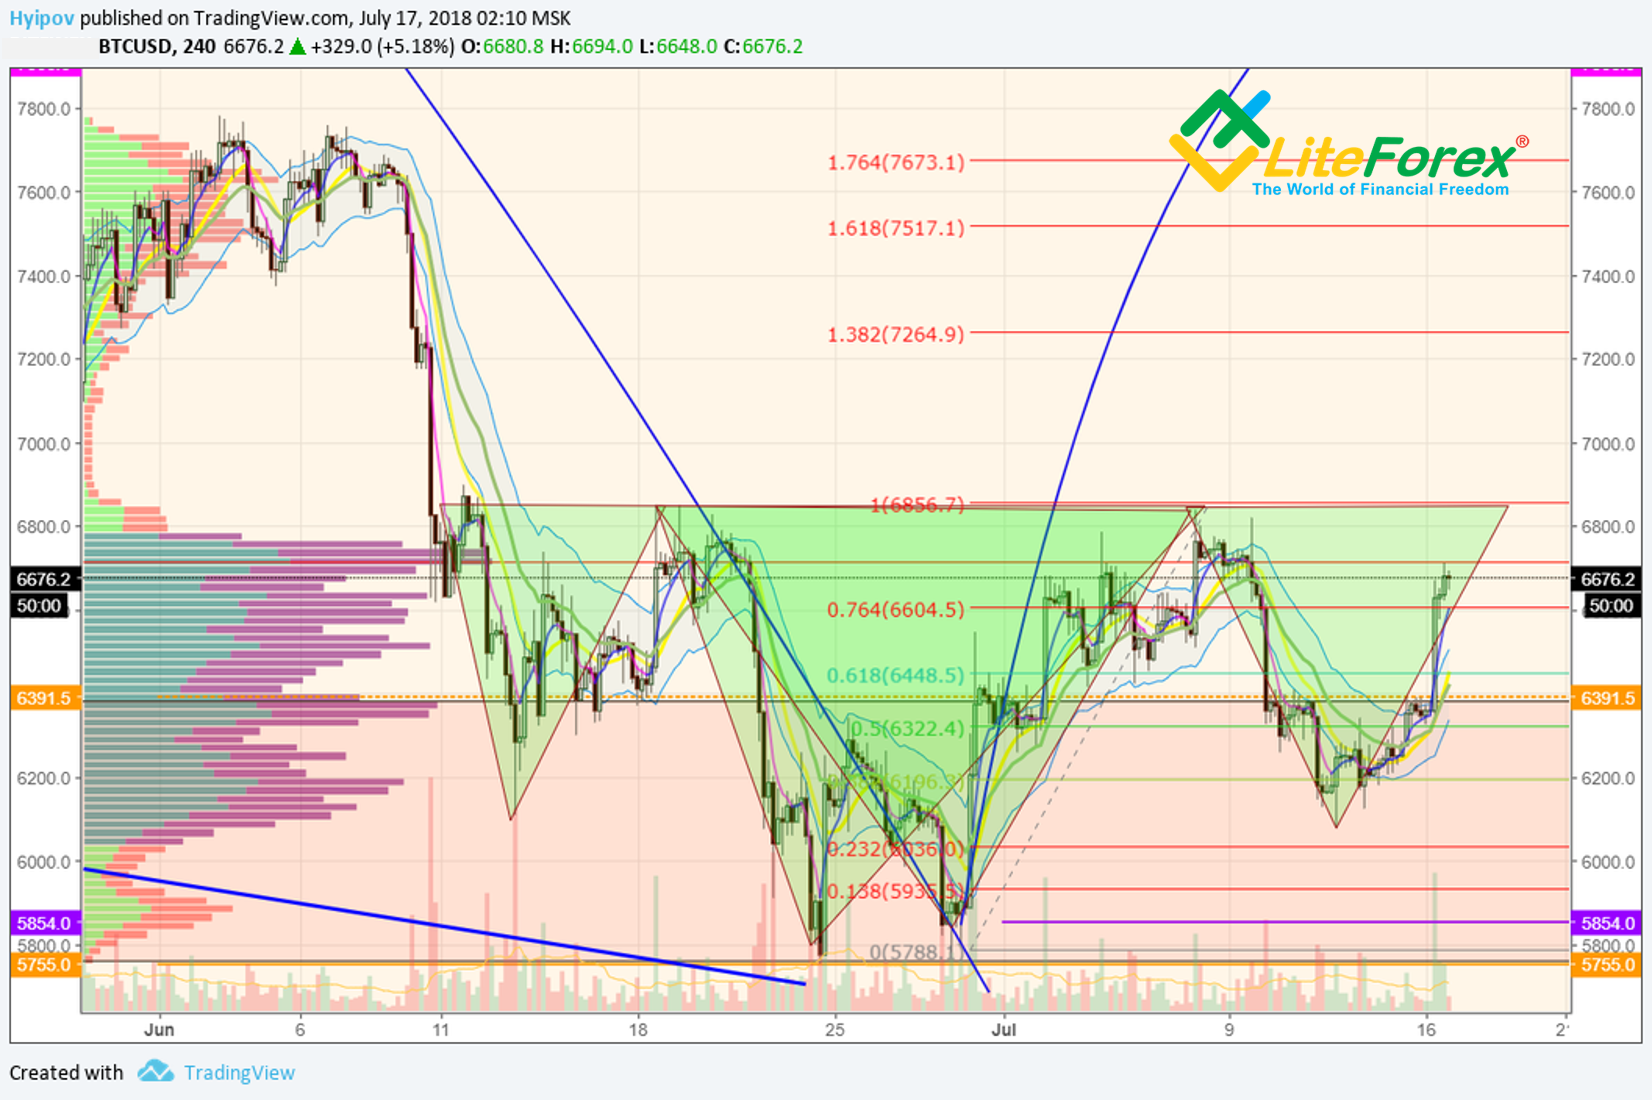
It is clear in the Bitcoin price chart above that, due to the yesterday’s momentum, the shoulder, seemed to be broken, takes the right place and there is a clear Head and Shoulders pattern.
Those, who are already rejoicing and anticipating their huge profits, I suggest cooling down a little and examining some reasons.
As a rule, such strong moves can be quite easily explained. Currently, Сointelegraph, perhaps one of the leading cryptocurrency mass media, linked that momentum to the information that BlackRock (NYSE:BLK) is beginning to assess potential involvement in Bitcoin.
However, if you pay attention to the original source, the reference is not to BlackRock official website or Twitter, but to the London newspaper Financial News.
Of course, I won’t say anything bad about Сointelegraph or the Financial News, but a reference to an original source that can’t be checked by anyone doesn’t seem to be that reliable for such famous media.
The matter is that to read the news in the Financial News, I must pass a paid registration, charged by 50 pounds a month, or 550 pounds a year. Although they offer a free trial for four months, I didn’t register on principle. I think the scheme, where the original source is the article, not available for free, to be a dishonest way of avoiding responsibility to the reader.
In addition, I’d like to note that similar information was released by Goldman Sachs (NYSE:GS) and Morgan Stanley (NYSE:MS), even if smaller, but more popular funds, in May; and nobody rushed to buy cryptocurrency then.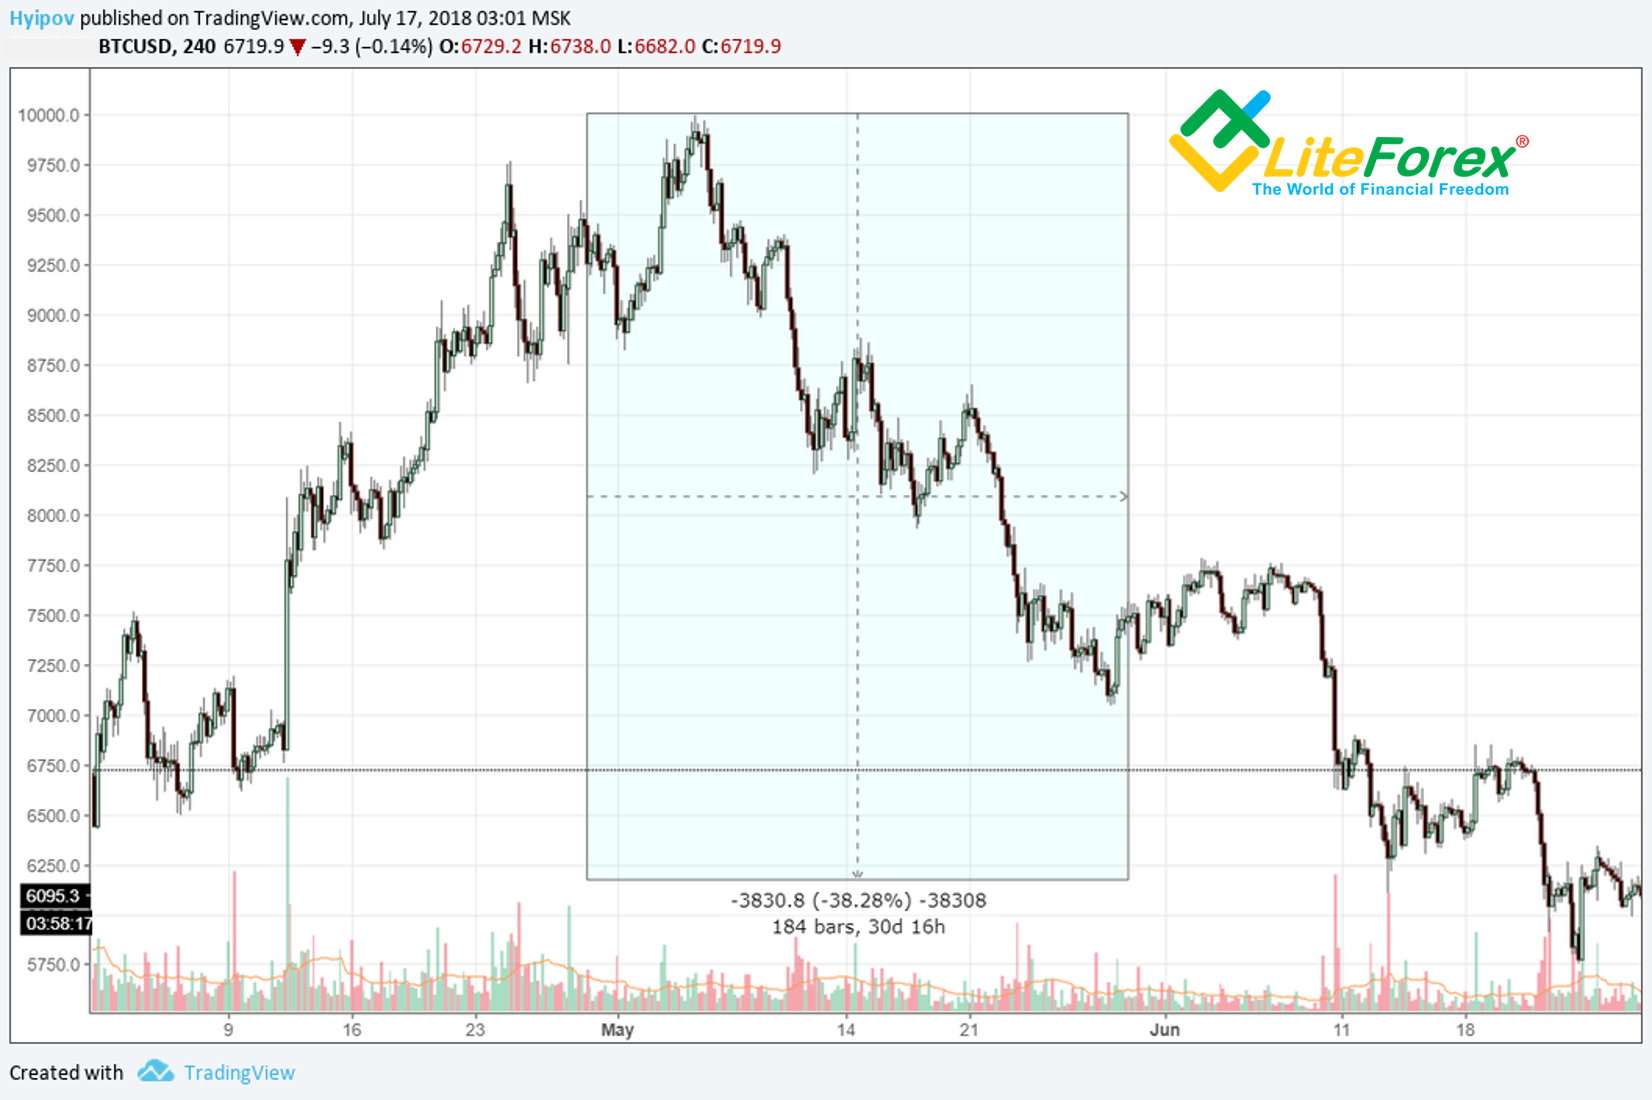
Moreover, if you look at Bitcoin price chart above, you’ll see that May featured the most of the recent bearish wave, which the market can’t still get over.
Finally, currently, the visual level looks like this: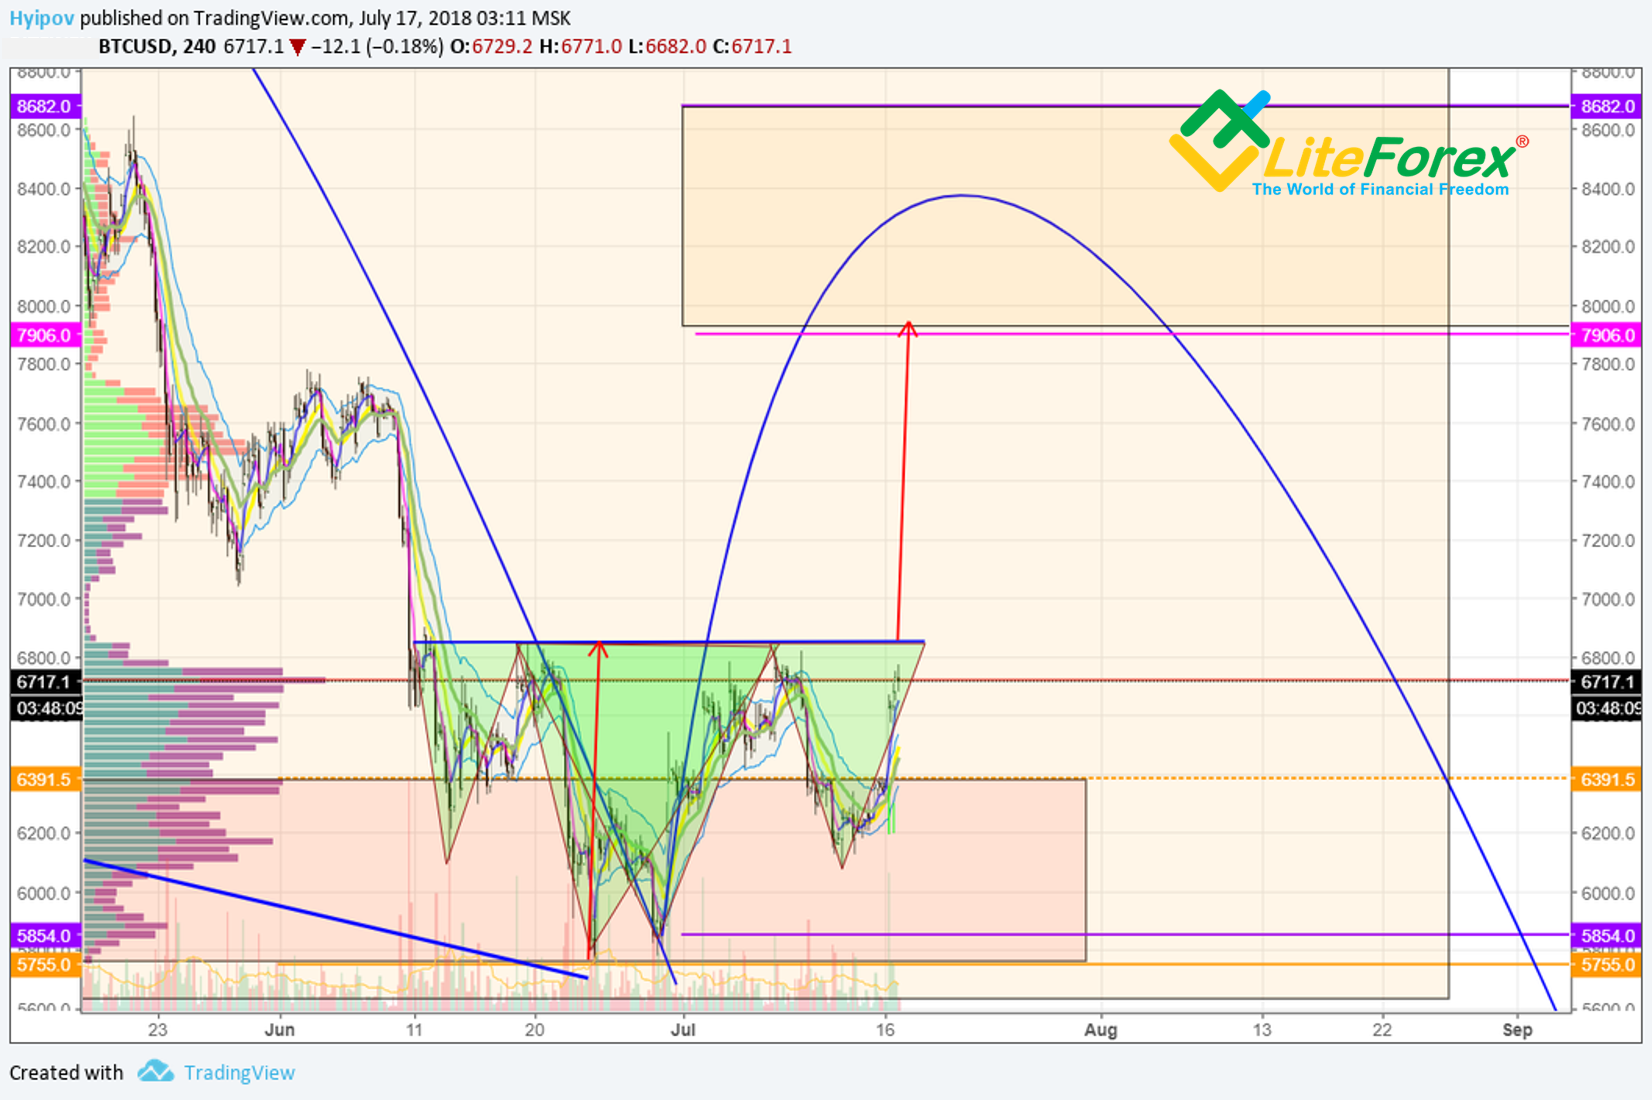
Now, even the least expert in technical analysis can say that level 6850 USD is the key one, the neck in S-H-S pattern. The target, if the level is broken out, is the extension of the distance between the Head and the Neck, that is around 7900 USD.
I know that the crypto exchange is not a charity fund, and if everybody starts buying, there will be no one to sell, and the crypto market will just stay still. But, fortunately, there are kind manipulators, who, when the level is broken out, with fake tears will sell their bitcoins to poor, gullible hamsters.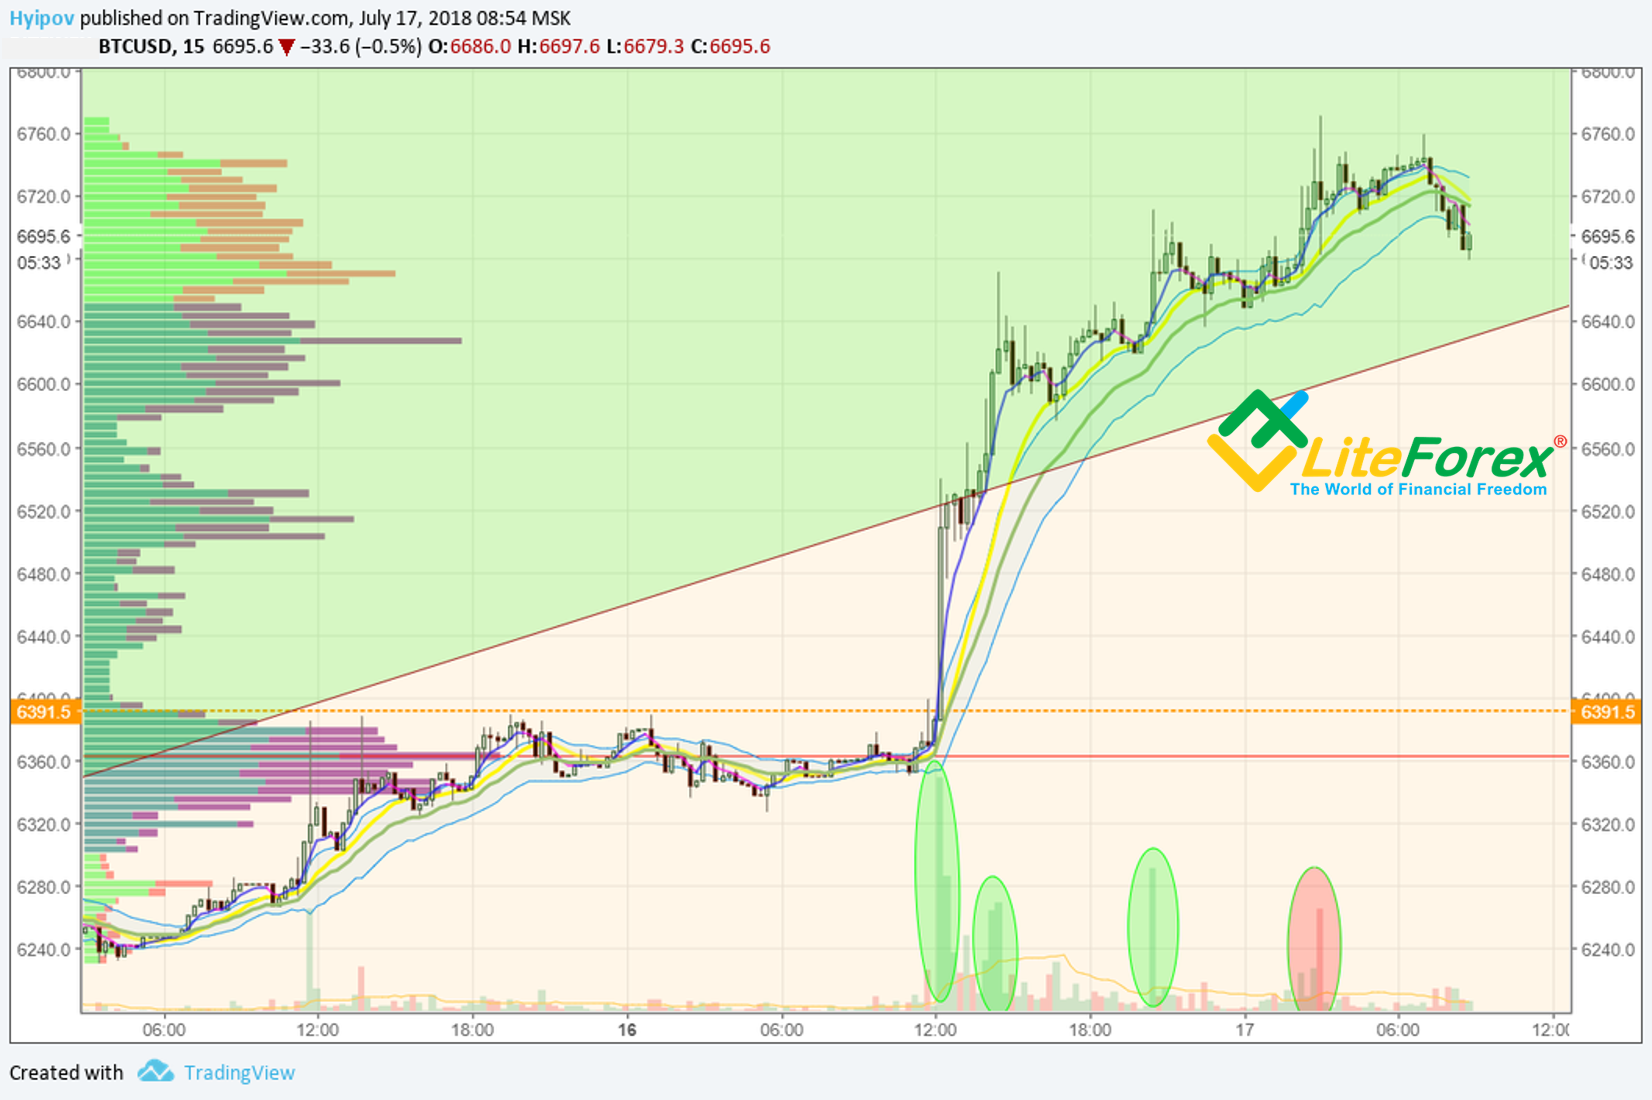
If you look at Bitcoin 15M timeframe, you’ll see that as early as on 16.07 morning, there were no signs of Bitcoin price rise. It surged just in a few minutes. It is not a figure of speech. In the fifteen-minute chart above, it is clear that 50% of the price rise happened during 15 minutes.
Of course, this price jump is not organic or natural.
I’ve already told about manipulators’ favorite tactics with three inflating of volume. Rarely, there can be 7-9 of them.
Currently, there are three stuffing of the volumes (green circles in the Bitcoin chart above). Manipulators, entered at 6800, that became a magnet for hamsters, and dumping their bitcoins amid the hamsters’ buyouts (marked with the red circle in the chart above).
I remember that I myself wrote in my earlier Bitcoin forecasts about the new cycle starting and an inverse Head and Shoulders pattern, as one of the scenarios for the new cycle beginning. But now, it is clear for me that there is no natural price rise in the market. Most participants are staying aside and only the puppet masters are drawing their patterns in the crypto market.
To figure out, where Bitcoin price will finally go, we need to study alternative scenarios for Bitcoin.
To do it, I divided the market into emotional intensity zones (it’s my own term) within the global bearish trend. First, I’d like to emphasize that I’ve developed this methodology myself and it is the first time I’ve applied it publicly. All similarities to the other systems are by chance, but I won’t be surprised if anybody has already written a book on this topic?
It is about visualization in the market sentiment chart and comparison it with the manipulators’ activities.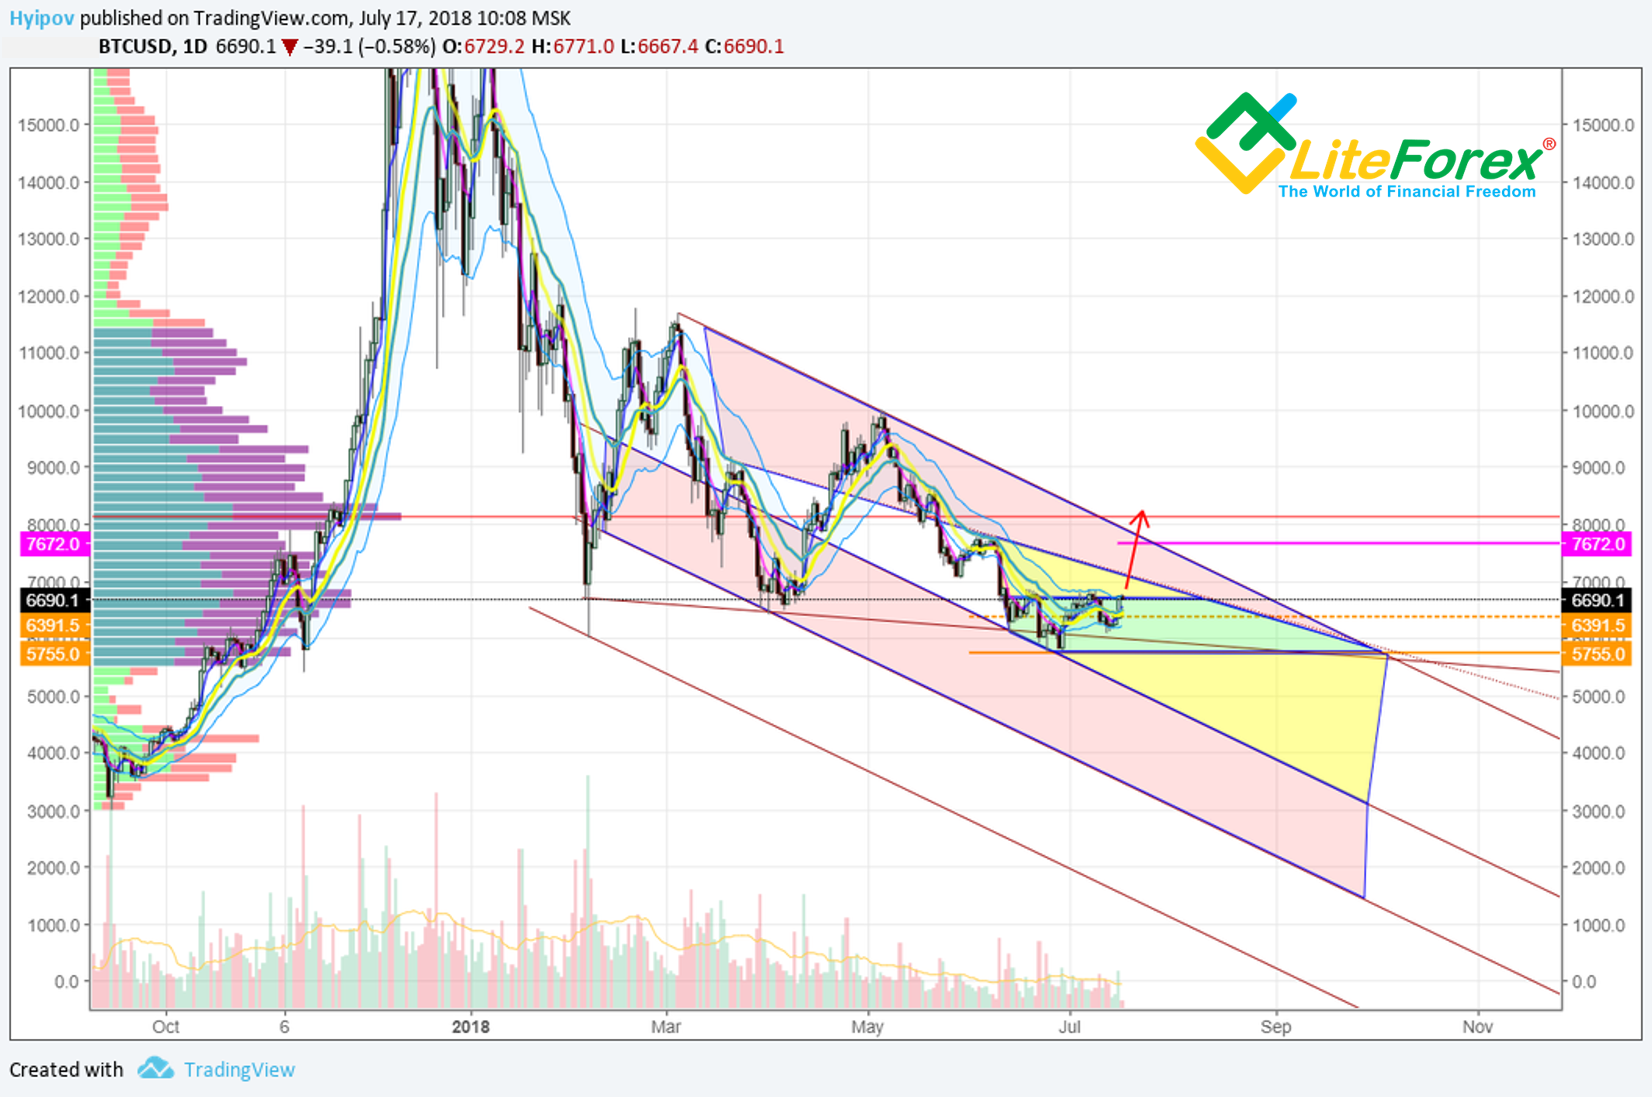
Within the bearish trend, I marked three zones of emotional intensity.
The red zone is the zone of high emotional intensity, the zone of fear and greed, where, in the bearish trend, the majority of people would trade in the same direction.
As I've said, manipulators always trade against the crowd; and it will be hard and costly for them in such zones oppose the common sentiment, but quite easy and discreetly to buy or sell their assets.
If this zone is broken out in the opposite to the trend direction, it will mean that the market sentiment has changed.
The yellow zone marks the part where a bearish or a bullish sentiment starts within the trend. These zones are convenient for manipulators to take the profits or buy with the aim of making profits, rather than manipulating, as they will trade against the majority of the market participants.
The green zone is the zone of free market moving, the balance zone, where neither buyers nor sellers have strong positions, and so, the trading volume is the lowest. In this zone, the crypto market manipulating is the safest and the cheapest for big players.
All the above zones are close to the key levels, whose breakouts indicate the change of the market sentiment.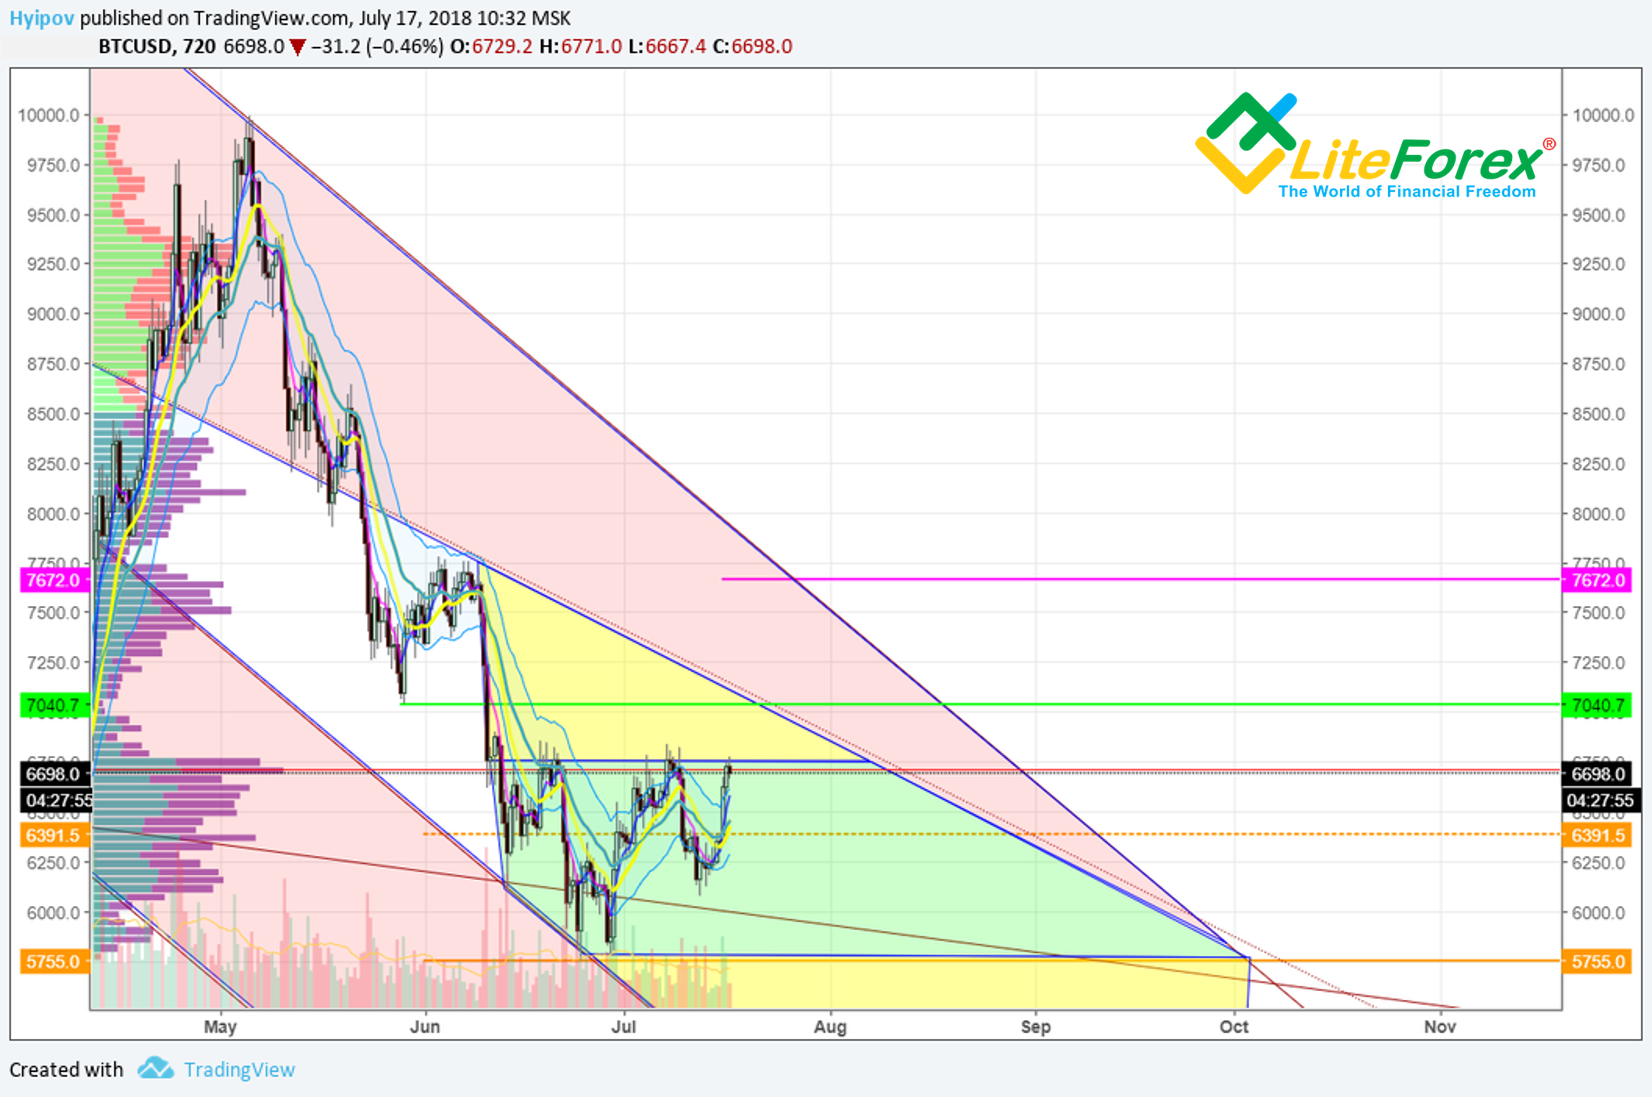
If you look at Bitcoin chart above, you’ll see that bitcoin ticker is close to the zone where it would be very easy for manipulators to dump their coins, following another pump, and to press the market down for entering new purchases.
As I’ve already mentioned, if level 6800 is broken through, most crypto traders will set a target at 7900. This target will provide the market with buy volume, where manipulators can excellently sell. Inside the yellow zone, there is unclosed level at 7040 USD. Bitcoin will hardly rise much higher than the zone, as manipulators will start selling.
Summary
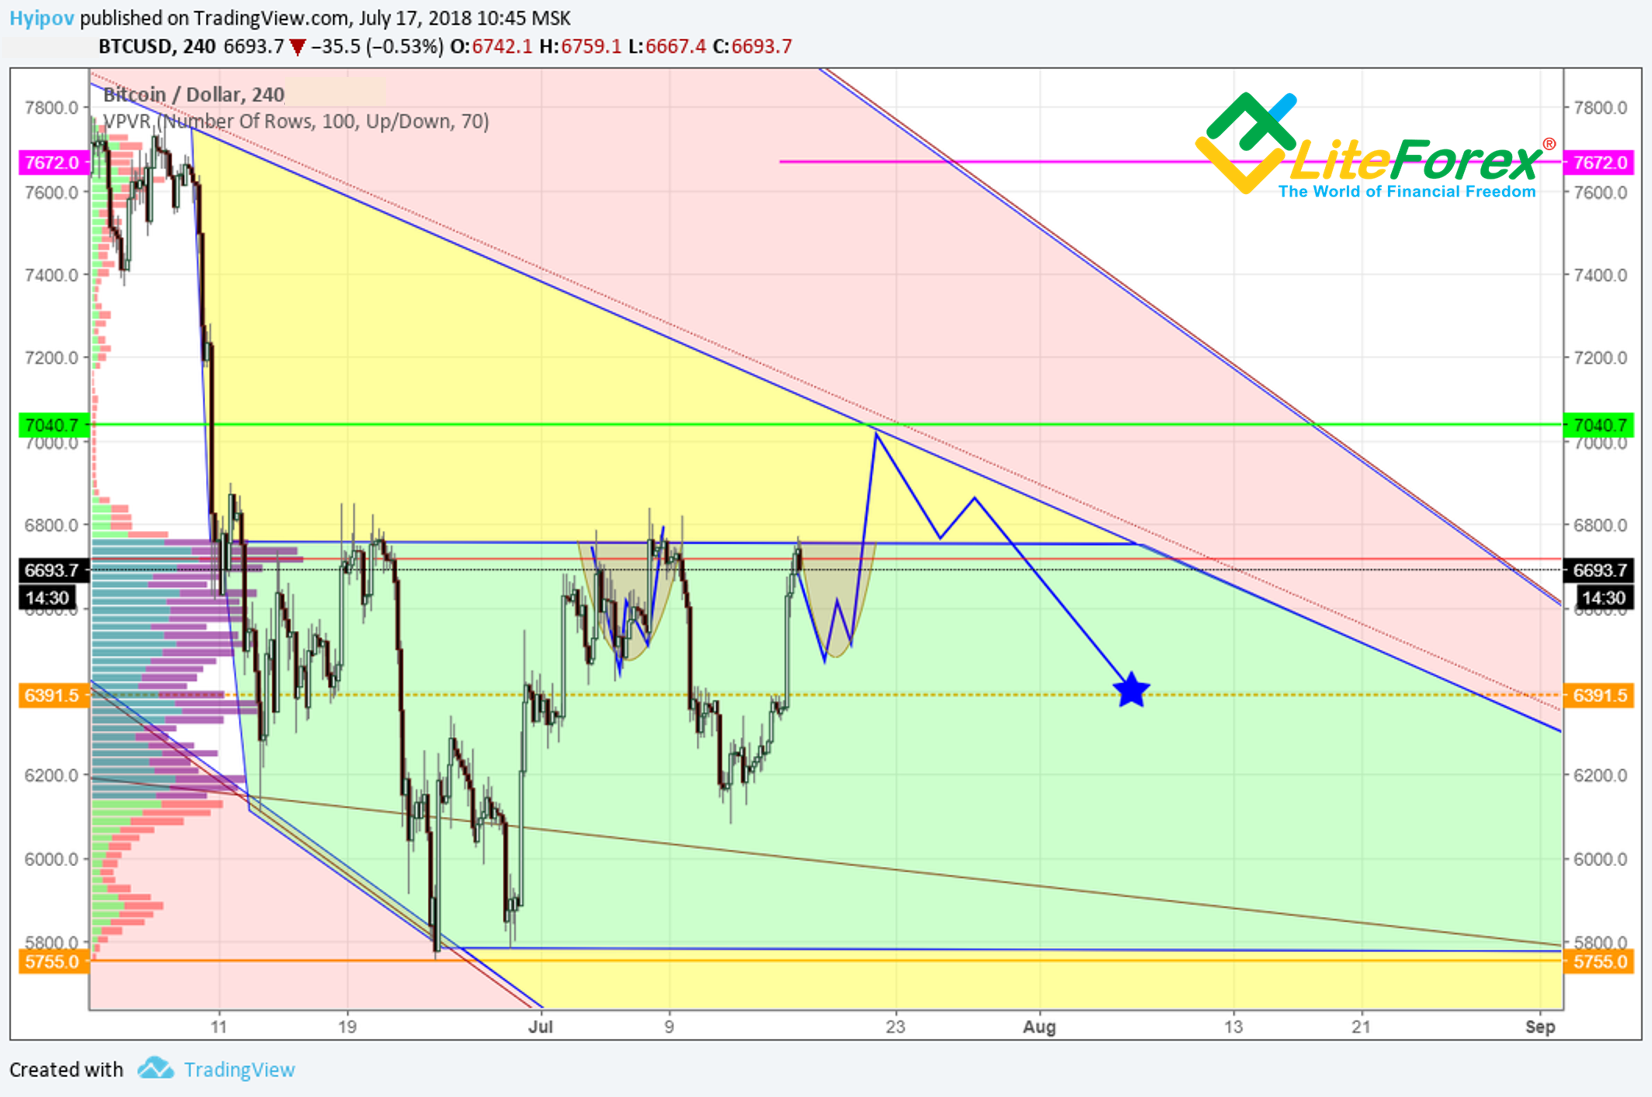
Bitcoin price is likely to roll down towards 6550 – 6390, where there will be another try to break through the psychologically important level by means of hamsters, supported by manipulators.
The profit-fixing will starts at the border with 7040, where from the ticker is likely slide down.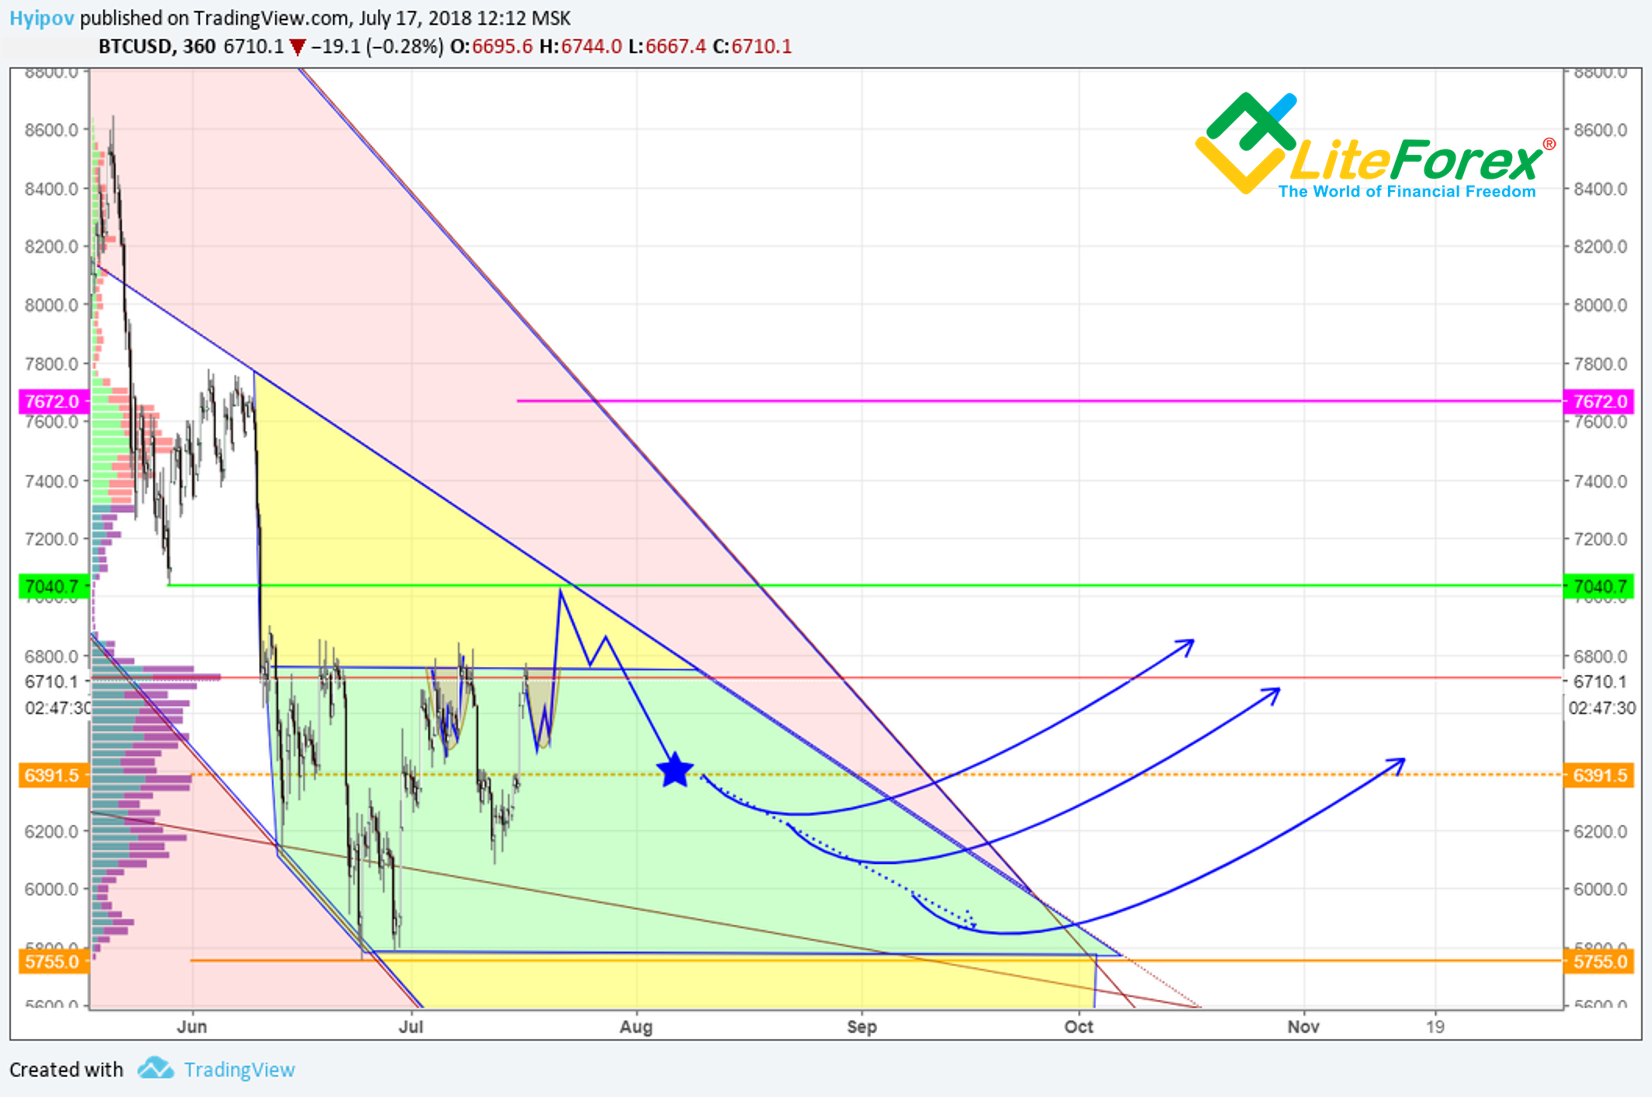
I must note that the longer has been the ticker trading in the Bitcoin downtrend, the weaker and the thinner is getting sell zone. In Bitcoin price chart above, it is clear that the bitcoin sell zone should almost disappear by October, and so, the price is likely to move from the bearish trend to a steady sideways trend soon.
That is my today’s BTC/USD alternative scenario.
I wish you good luck and good profits!
