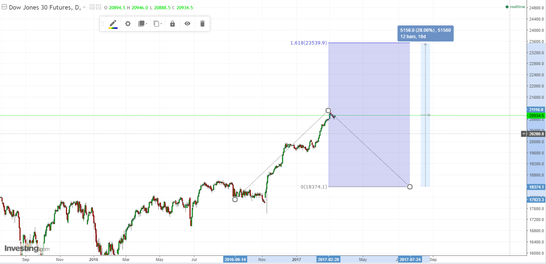
In a previous article from March 10 on my personal finance blog site, I wrote that the Dow Jones Index was due a pullback, and for long investors this pullback would be a "buy the dip" opportunity. I suggested a 12% move lower from the then level of 20,923, to around 18,365. From here I projected a final end point to the 8 year bull market, of 23,500 for the Dow.

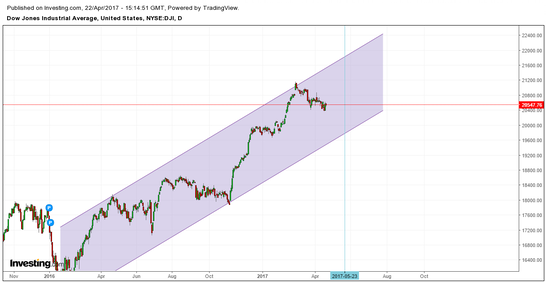
In the six weeks since that prediction as of Friday April 21, the market has meandered about 2% lower to 20,547, shown in the chart below.

The market is clearly showing a lot of resilience. The gains post the US election are mostly being held. It now seems more likely that the current pullback, which we have been in since the most recent high of 21,169 on March 1, will finish somewhere along the trend channel going back to February 2016.
On the chart above I have suggested an intersection with the trend channel and, therefore, projected low and possible long entry level, at 19770, in late May.
The smaller size of the pullback requires that my previous upside target is also revised higher, from 23,500 as per my March 10 article, to a new target of 25,000.
So why would the Dow go to 25000?
This leaves the question, what emotional or fundamental factor is going to drive the US large cap market 20% higher, from already high levels? It is not going to be the Fed - since the Fed is now raising rates and also beginning to unwind the balance sheet, which in turn should begin to drive bond yields higher and depress equity valuations.
It is not going to be favorable moves in the value of the dollar since, in my view, the dollar is due to strengthen significantly, depressing valuations of US equities on a constant currency basis and reducing the value of oversees income when translated back into dollars. It is not going to be earnings growth in the US domestic economy, as the US consumer continues to suffer with stagnant wages and low job security. It might be the enactment by President Trump of business friendly regulatory and tax policies, but this on its own is not enough for such a large move in the face of so many other value depressing variables.
The answer to the question, is that global equities will be driven higher by a resurgence in Chinese equities, and by the corresponding positive impact this move will have on global market sentiment.
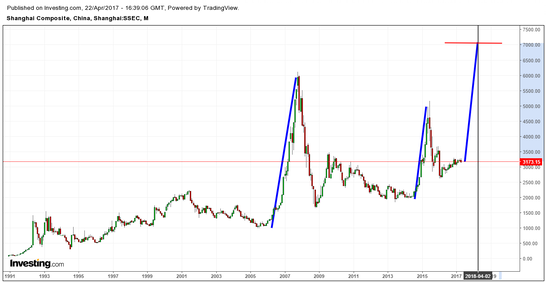
The below chart shows the Shanghai Composite, (which is a market capitalization weighted index of large and mid-cap Chinese stocks) from 1991 to present.

There have been two large price escalations and collapses in this time period - one in 2007/08 and one in 2014/15. As large as these moves were, neither was the final story in a major cycle completion.
The current cycle of massive Chinese growth has been ongoing since the early 2000s, and while there have been set backs, there has been no major debt crisis, economic collapse, or significant slowing of the GDP growth since the cycle started. In other words, we are due the final move higher before the cycle from the early 2000s completes.
I would anticipate that the projected final move is of similar speed as previous moves, as indicated by the parallel blue lines on the chart above.
Using this analysis, and in conjunction with other technical projection methods, I am proposing a price target of 7000 on the Shanghai composite or about 120% higher than current levels, finishing in April 2018. This would represent a large move by US and European index standards but in historical terms for this index, such a move is not unusual: the increase from May 2005 to October 2007 for example was more than 500%.
For investors looking to gain exposure to this move an ETF would be the obvious choice. The largest China ETF by assets under management is the iShares China Large-Cap (NYSE:FXI) which is listed on NYSE and denominated in dollars. It tracks the top 50 Chinese companies by market capitalization. There are other similar ETFs listed on the major exchanges in London, Zurich and Paris. (These ETFs are not hedged so devaluation of the yuan relative to the currency of the ETF would impact the returns).
