Breaking News
Investing Pro 0
Free Webinar - Webinar: Simplify Options Trading | Thursday, September 28, 2023 | 08:00PM EDT Enroll Now

Asia Markets Seek Safe Havens

By MarketPulse (Jeffrey Halley)Market OverviewApr 12, 2017 02:33AM ET
www.investing.com/analysis/asia-markets-seek-safe-havens-200182397
Asia Markets Seek Safe Havens
By MarketPulse (Jeffrey Halley)   |  Apr 12, 2017 02:33AM ET
Saved. See Saved Items.
This article has already been saved in your Saved Items
 
 
USD/JPY
-0.04%
Add to/Remove from Watchlist
Add to Watchlist
Add Position

Position added successfully to:

Please name your holdings portfolio
 
EUR/JPY
-0.04%
Add to/Remove from Watchlist
Add to Watchlist
Add Position

Position added successfully to:

Please name your holdings portfolio
 
XAU/USD
+0.06%
Add to/Remove from Watchlist
Add to Watchlist
Add Position

Position added successfully to:

Please name your holdings portfolio
 
XAG/USD
+0.15%
Add to/Remove from Watchlist
Add to Watchlist
Add Position

Position added successfully to:

Please name your holdings portfolio
 
JP225
-1.48%
Add to/Remove from Watchlist
Add to Watchlist
Add Position

Position added successfully to:

Please name your holdings portfolio
 
Gold
+0.07%
Add to/Remove from Watchlist
Add to Watchlist
Add Position

Position added successfully to:

Please name your holdings portfolio
 

The G-7 Nations acting like the League of Nations seems to have finally opened the floodgates as markets seek safe havens ahead of the Easter break.

As expected, in all honesty, the G-7 officials meeting about a recalcitrant Russia produced nothing new on the sanctions front. Talk of vested interests amongst the G-7 members is perhaps a bit harsh when cool heads should prevail. It did give an overall look of appeasement though, and this seems to have stirred the U.S. markets into action with the theme of the session being seeking safe havens anywhere.

Gold rose 20 USD to 1275, U.S 10-year yields fell below 2.30%, and the USD/JPY dropped 100 points and finally broken the crucial level at 110.00. Elsewhere the US Dollar Index pushed slightly lower, and the Korean Won fell to just shy of the psychological 1150 level.

The theme continues in Asia with equities generally in the red to start the session. Most notably the Nikkei 225 and KOSPI. Precious metals continue to be bid across the board; the U.S. 10-Year trades at 2.28% and both Brent and WTI have moved higher. Tensions in Europe, the Middle East and the Korean Peninsular have made the geopolitical situation more complicated than re-writing the United Airlines Continental Holdings Inc (NYSE:UAL) customer service manual.

As Easter approaches Asia, in particular, is focusing on this Easter Friday which is the anniversary of the birthday of the North Korean founder, Kim Il-sung. The North would normally do “something” on this day, as is their want. This year, it’s an almost global holiday, and given the present backdrop, it will have more poignancy. This should ensure that Asia remains solidly in a risk-off mode for the rest of the week, come what may in other centres.

Looking at the markets in Asia today.

FX

USD/JPY

The story of the night as repatriation flows turned to a deluge and USD/JPY finally cracked the 110.00 level. The USD/JPY continues to trade heavily in Asia with the Nikkei. However, those expecting a wholesale collapse may be disappointed as the USD/JPY enters oversold territory on the RSI.

The 110.00 level is now resistance followed by 111.50.

Support appears initially at the 50% Fibonacci at 109.13 and then the 200-day moving average at 108.55.
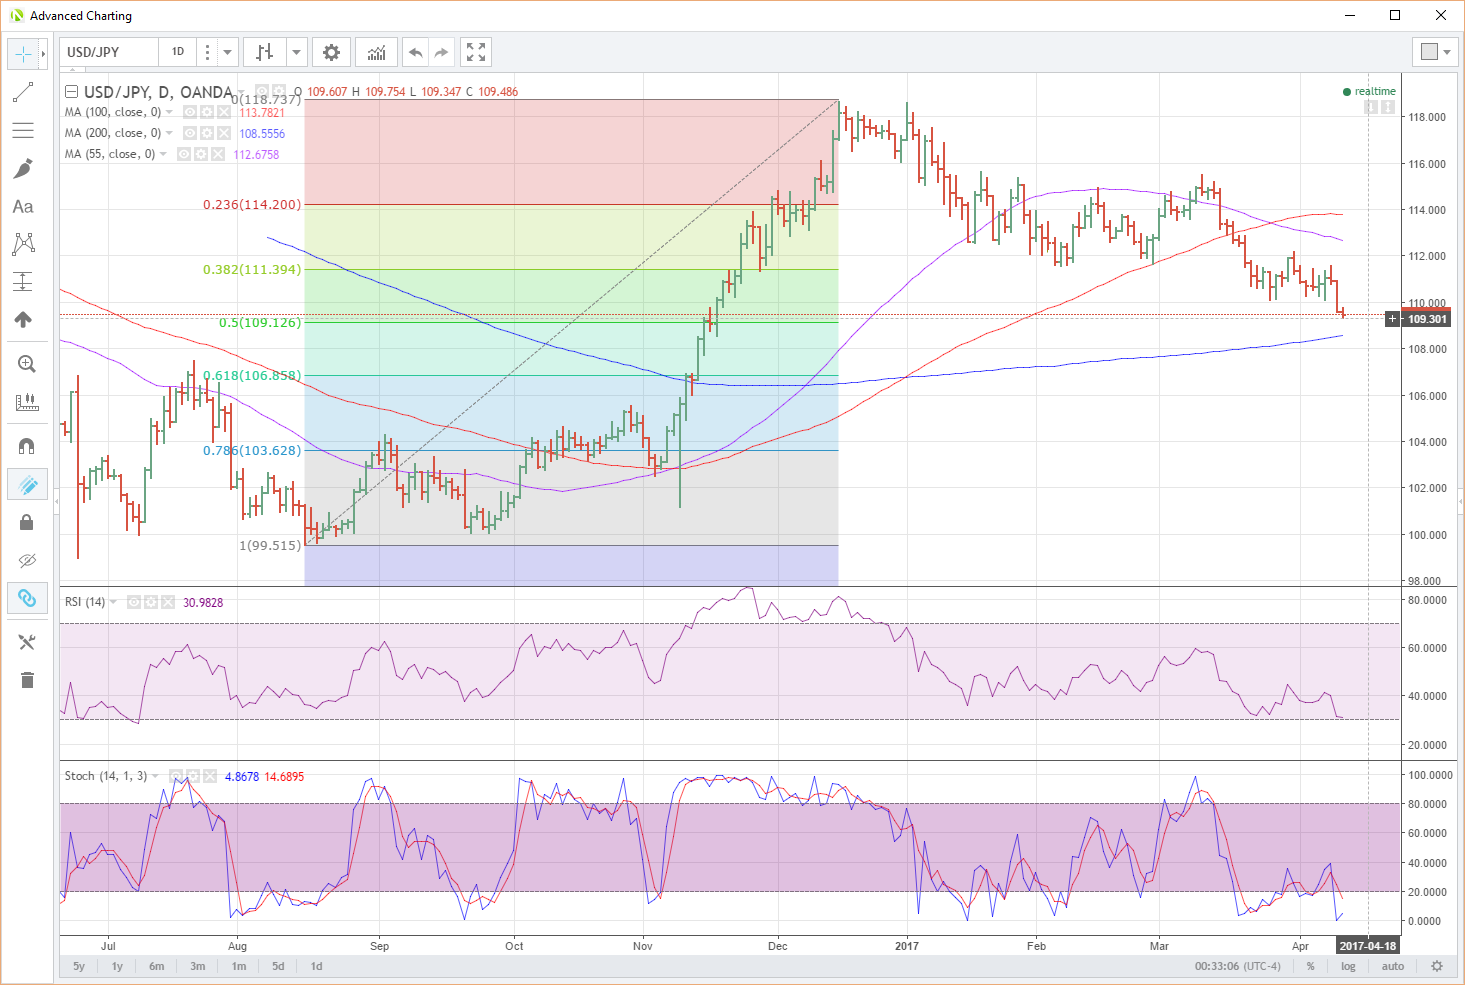
USD/JPY Daily Chart
USD/JPY Daily Chart


USD/JPY Daily

EUR/JPY

It is reasonable to assume that every cross ending in XXX/JPY didn’t have a great night. EUR/JPY being no exception with its 2nd consecutive close below its 200-day moving average. However, I do note that the cross is now very oversold on it RSI and Stochastic.

Resistance is at the top of its downward parallel channel at 117.80 which is also the area of the 200-day moving average. Initial support is around 80 points away at the bottom of the channel at 115.50. A breakout from here would set the

Initial support is around 80 points away at the bottom of the channel at 115.50. A breakout from here would set the scene technically for a move sub 114.00.
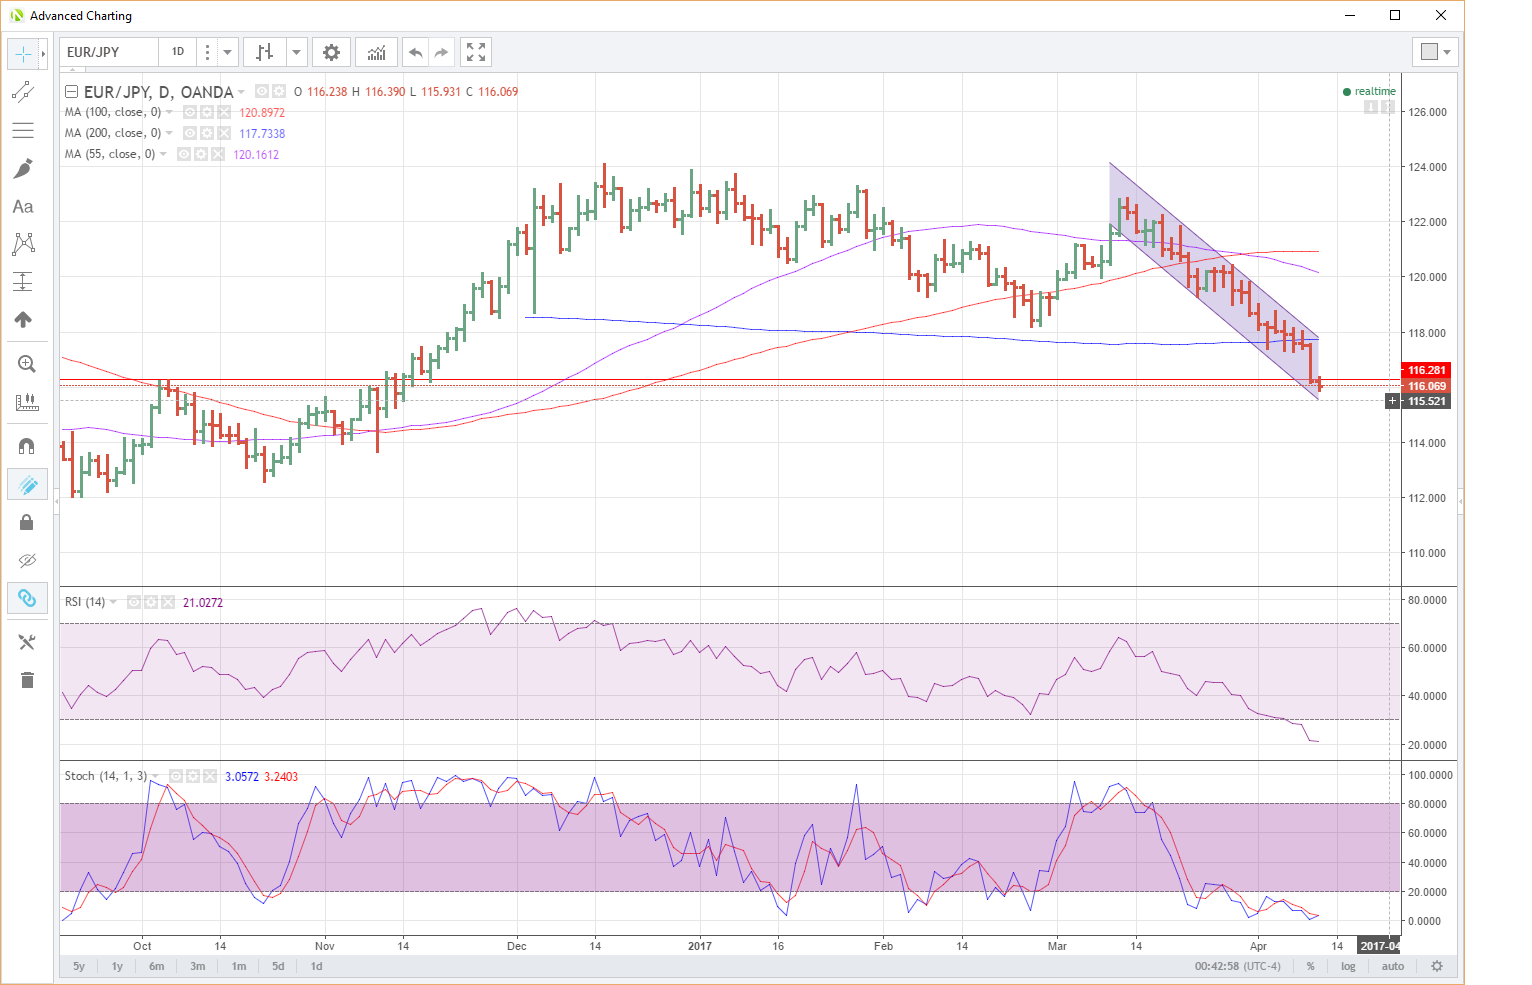
EUR/JPY Daily Chart
EUR/JPY Daily Chart

EUR/JPY Daily

USD/CNH

Quietly appreciated against the USD in the Asian session as the PBOC refrained from open market operations yet again. A slightly softer than expected CPI read of -0.3 % M/M saw a small reversal as the edge was taken of tightening expectations.

With USD/CNH trading at 6.9020 as I write, the key levels continue to be 6.8400 and 6.9300 with the cross continuing to range.
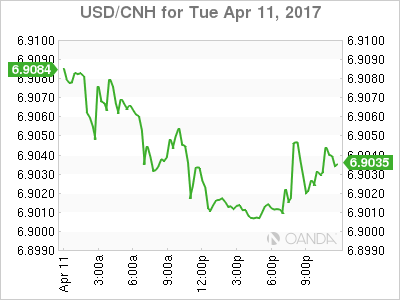
USD/CNH Daily Chart
USD/CNH Daily Chart

PRECIOUS METALS

Gold

Precious metals were big movers overnight including gold. The 1.60% move higher to 1275 where we are now trading is significant because we have finally had a close above the 200-day moving average after failures all year.

Apart from being an obvious beneficiary of the delayed safe-haven trade, from a technical perspective, the charts point to a move above 1300 now.

Support is clearly delineated at the 200-day moving average at 1257.50 and 1240.

Resistance is at the Asia session high of 1280 before a triple top from October at 1308. However, traders should keep an eye on the RSI and Stochastics for signs of bearish divergence.
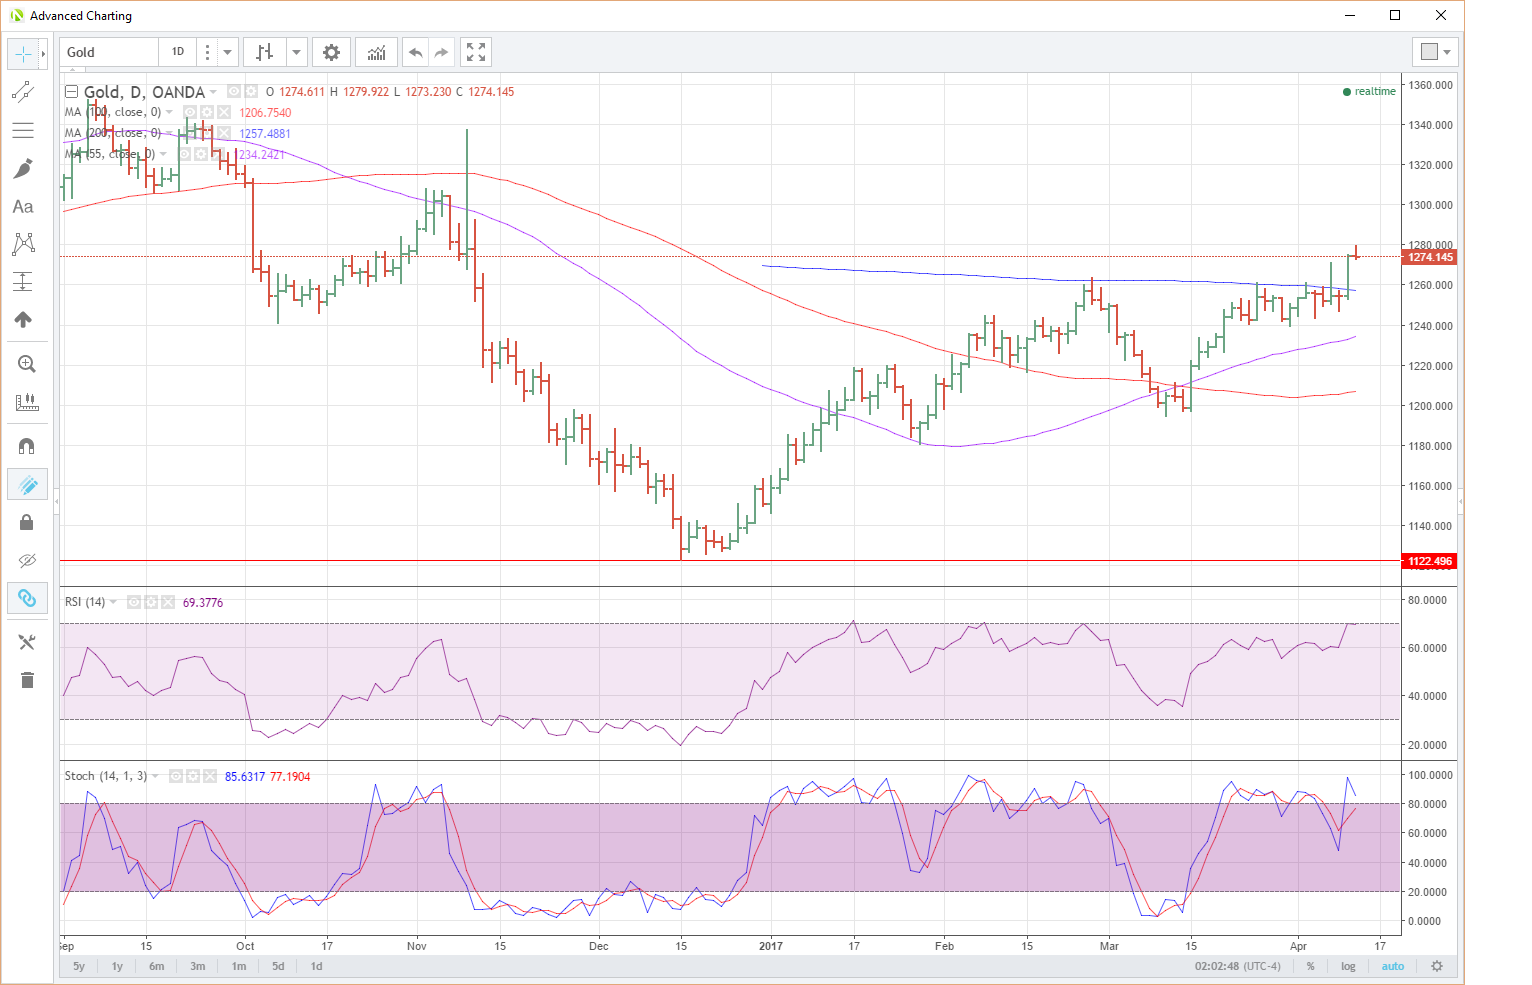
Gold Daily Chart
Gold Daily Chart

Silver

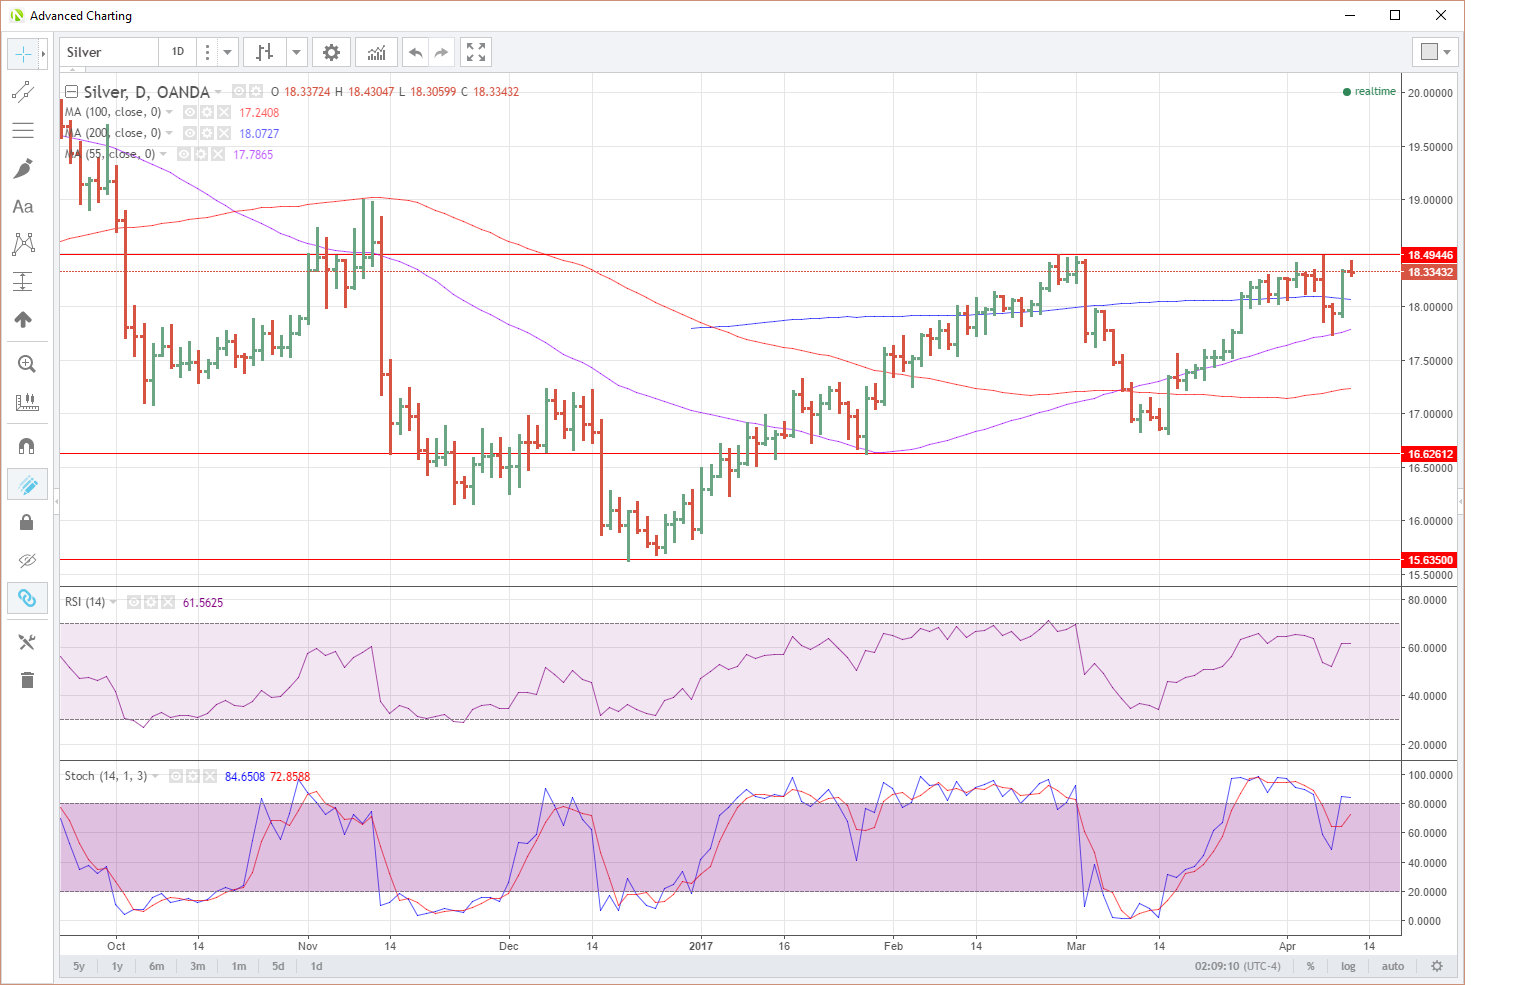
Rose 2.40% in overnight trading to 18.3250 following gold as a safe haven darling. Asia has had another look at the upside to 18.4400 before falling back to roughly unchanged at 18.3250.

Silver has key resistance just above here at 18.4500 where it has failed multiple times, most recently last Friday. A close above clearly opens a technical move to 19.0000 on the charts.

Support meanwhile, lies at 18.0725 the 200-day moving average and then yesterday’s lows at 17.9000.
Silver Daily Chart
Silver Daily Chart

ASIA INDICES

Nikkei 225

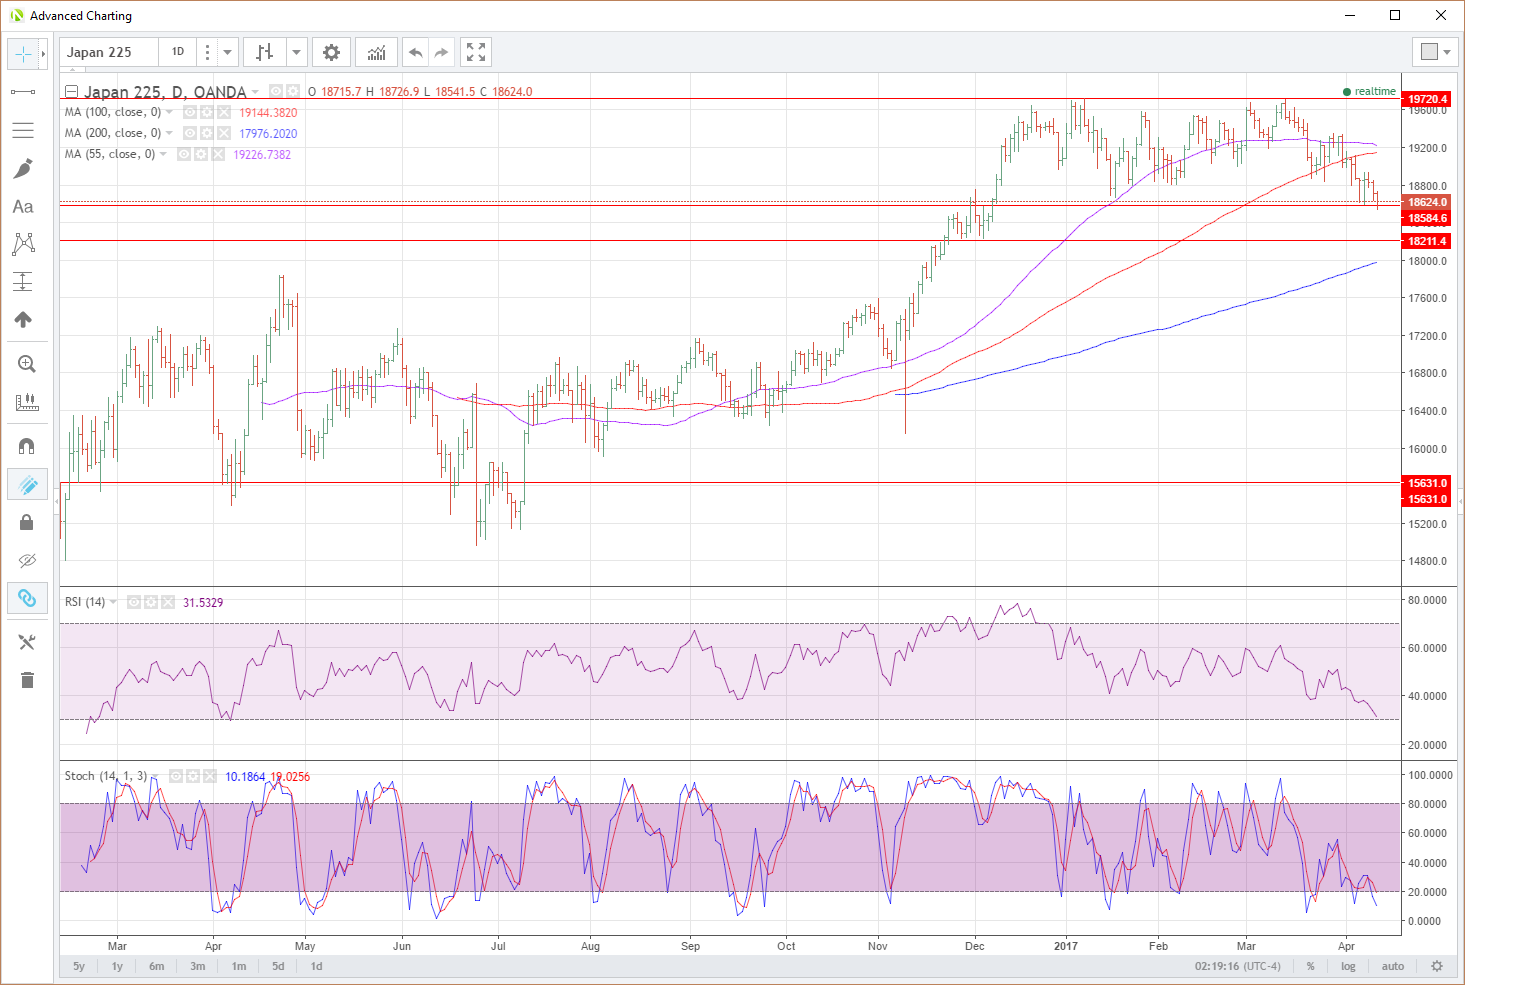
The Nikkei has fallen over 1.0% today as the large move up in the USD/JPY saw exporter stocks sold. The ongoing situation with Toshiba Corp. (T:6502) and its non-endorsed accounts continues to weigh as well, with delisting a real possibility. The YEN appreciation on safe haven flows and a compressing of the US/Japan yield spreads will continue to weigh on the index. The Nikkei continues to bump along its four-month lows.

The Nikkei has intraday support at 18.585 with a daily close below suggesting a move to the next support around 18200. We have traded below this level today, but a recent bounce to 18626 means it is the daily close we must watch.

The Nikkei has resistance at 18945, Monday’s high and then the 19145/19225 zone, the 100 and 200-day moving averages.
Nikkei Daily Chart
Nikkei Daily Chart

Nikkei 225

SUMMARY

Global tensions and a rush to safety ruled the New York session, and this has followed through to Asia. The break of 110 in USD/JPY is extremely significant. With a long weekend globally nearly upon us and further North Korea risk this Friday, the safety first theme is likely to continue.

Original post

Asia Markets Seek Safe Havens
 

Related Articles

Asia Markets Seek Safe Havens

Add a Comment

Comment Guidelines

We encourage you to use comments to engage with other users, share your perspective and ask questions of authors and each other. However, in order to maintain the high level of discourse we’ve all come to value and expect, please keep the following criteria in mind:  

  •            Enrich the conversation, don’t trash it.

  •           Stay focused and on track. Only post material that’s relevant to the topic being discussed. 

  •           Be respectful. Even negative opinions can be framed positively and diplomatically. Avoid profanity, slander or personal attacks directed at an author or another user. Racism, sexism and other forms of discrimination will not be tolerated.

  • Use standard writing style. Include punctuation and upper and lower cases. Comments that are written in all caps and contain excessive use of symbols will be removed.
  • NOTE: Spam and/or promotional messages and comments containing links will be removed. Phone numbers, email addresses, links to personal or business websites, Skype/Telegram/WhatsApp etc. addresses (including links to groups) will also be removed; self-promotional material or business-related solicitations or PR (ie, contact me for signals/advice etc.), and/or any other comment that contains personal contact specifcs or advertising will be removed as well. In addition, any of the above-mentioned violations may result in suspension of your account.
  • Doxxing. We do not allow any sharing of private or personal contact or other information about any individual or organization. This will result in immediate suspension of the commentor and his or her account.
  • Don’t monopolize the conversation. We appreciate passion and conviction, but we also strongly believe in giving everyone a chance to air their point of view. Therefore, in addition to civil interaction, we expect commenters to offer their opinions succinctly and thoughtfully, but not so repeatedly that others are annoyed or offended. If we receive complaints about individuals who take over a thread or forum, we reserve the right to ban them from the site, without recourse.
  • Only English comments will be allowed.
  • Any comment you publish, together with your investing.com profile, will be public on investing.com and may be indexed and available through third party search engines, such as Google.

Perpetrators of spam or abuse will be deleted from the site and prohibited from future registration at Investing.com’s discretion.

Write your thoughts here
 
Are you sure you want to delete this chart?
 
Post
Post also to:
 
Replace the attached chart with a new chart ?
1000
Your ability to comment is currently suspended due to negative user reports. Your status will be reviewed by our moderators.
Please wait a minute before you try to comment again.
Thanks for your comment. Please note that all comments are pending until approved by our moderators. It may therefore take some time before it appears on our website.
Comments (1)
Kim Boesgaard Lauritsen
Kim Boesgaard Lauritsen Apr 12, 2017 4:48AM ET
Saved. See Saved Items.
This comment has already been saved in your Saved Items
Thank you very much for this analysis, yes got to keep and eye on the Fibonacci...
 
Are you sure you want to delete this chart?
 
Post
 
Replace the attached chart with a new chart ?
1000
Your ability to comment is currently suspended due to negative user reports. Your status will be reviewed by our moderators.
Please wait a minute before you try to comment again.
Add Chart to Comment
Confirm Block

Are you sure you want to block %USER_NAME%?

By doing so, you and %USER_NAME% will not be able to see any of each other's Investing.com's posts.

%USER_NAME% was successfully added to your Block List

Since you’ve just unblocked this person, you must wait 48 hours before renewing the block.

Report this comment

I feel that this comment is:

Comment flagged

Thank You!

Your report has been sent to our moderators for review
Continue with Google
or
Sign up with Email