Get 40% Off
👀 👁 🧿 All eyes on Biogen, up +4,56% after posting earnings. Our AI picked it in March 2024.
Which stocks will surge next?
Unlock AI-picked Stocks

Are Current U.S. Stock Market Returns Extraordinary?

Published 01/07/2020, 03:51 PM
Updated 07/09/2023, 06:31 AM

The bull run in U.S. equities in recent years strikes many investors as something other than a run-of-the-mill rally. Although Mr. Market has dispensed several sharp corrections, it’s hard to overlook the fact that a buy-and-hold strategy for, say, an S&P 500 Index fund has been a mostly non-stop party of late. Is that unusual? The answer depends on your definition of “unusual” and your choice of a time window. For some perspective, let’s stack up the latest trailing performances for the S&P against its track record through the decades.

Let’s begin with rolling 1-year returns since 1960 (based on 252 trading days). The current one-year performance (through yesterday, Jan. 6) is 28.2%. That’s an impressive gain, but is it out of the ordinary? Yes, it is. As the chart below shows, the top-quartile distribution of one-year returns for the S&P 500 since 1960 is a 18.3%-to-68.6% range. By that standard, the current one-year advance (indicated by the blue line) is easily in the top quartile—in fact, it’s a top-decile return. (The red line shows the theoretical returns if results followed a normal distribution.)
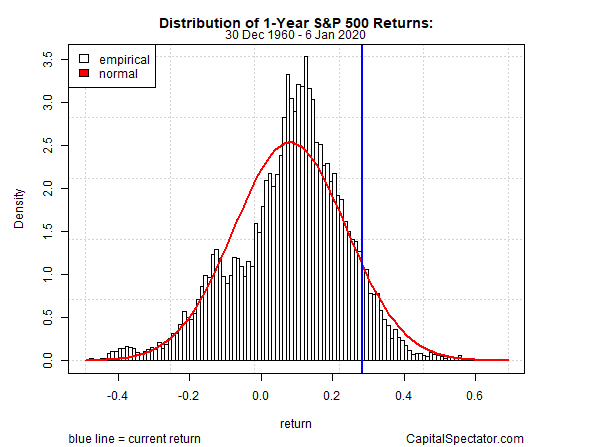
1-Year S&P 500 Returns

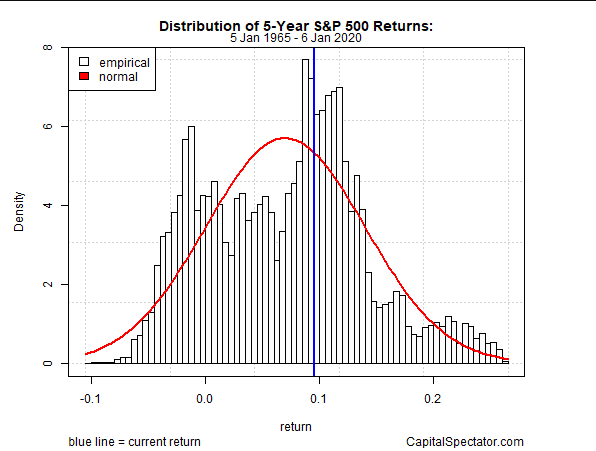
Next, consider how the latest 5-year annualized return compares with history (1260 trading days). The current 9.5% increase is middling relative to history since 1965 — the performance ranks just below the median return. To be sure, earning a 9.5% through time is no one idea’s of weak results. But from the perspective of how the S&P has behaved for this time window the current 5-year performance is hardly extraordinary.
3rd party Ad. Not an offer or recommendation by Investing.com. See disclosure here or remove ads .
5-Year S&P 500 Returns

Let’s conclude our brief review of performance distributions with the 10-year annualized return, which is currently 11.2% (based on 2520 trading days). That translates to just below the 80th decile – a moderately extraordinary result.
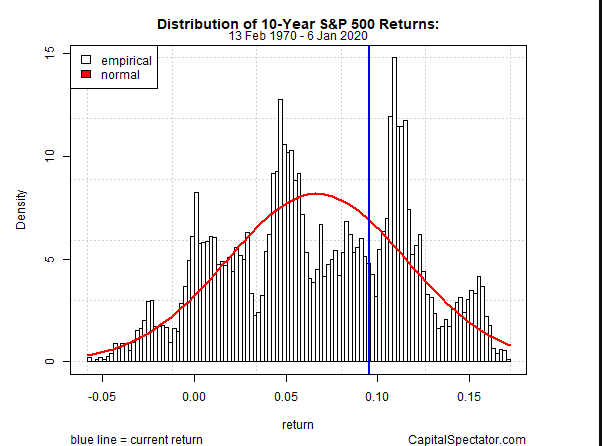
10-Year S&P 500 Returns

In an upcoming post, I’ll continue this series by comparing S&P 500 in terms of risk and reviewing how the current profile stands up vs. history.

Latest comments

Risk Disclosure: Trading in financial instruments and/or cryptocurrencies involves high risks including the risk of losing some, or all, of your investment amount, and may not be suitable for all investors. Prices of cryptocurrencies are extremely volatile and may be affected by external factors such as financial, regulatory or political events. Trading on margin increases the financial risks.
Before deciding to trade in financial instrument or cryptocurrencies you should be fully informed of the risks and costs associated with trading the financial markets, carefully consider your investment objectives, level of experience, and risk appetite, and seek professional advice where needed.
Fusion Media would like to remind you that the data contained in this website is not necessarily real-time nor accurate. The data and prices on the website are not necessarily provided by any market or exchange, but may be provided by market makers, and so prices may not be accurate and may differ from the actual price at any given market, meaning prices are indicative and not appropriate for trading purposes. Fusion Media and any provider of the data contained in this website will not accept liability for any loss or damage as a result of your trading, or your reliance on the information contained within this website.
It is prohibited to use, store, reproduce, display, modify, transmit or distribute the data contained in this website without the explicit prior written permission of Fusion Media and/or the data provider. All intellectual property rights are reserved by the providers and/or the exchange providing the data contained in this website.
Fusion Media may be compensated by the advertisers that appear on the website, based on your interaction with the advertisements or advertisers.
© 2007-2024 - Fusion Media Limited. All Rights Reserved.