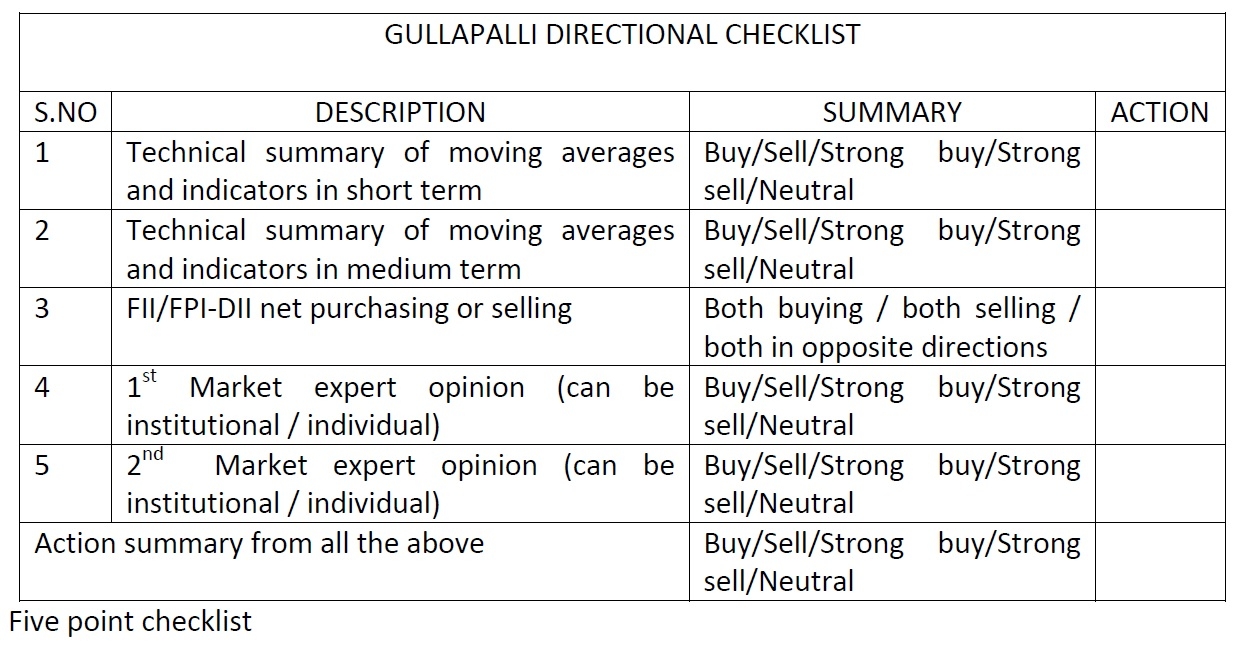
Though the checklist and examples shown in this article are for Indian market index NIFTY, it can be used for anticipating the trajectory of other indices, individual stocks, currencies and commodities as well.
Checklists are used in many professions including stock markets to improve the quality of the work. Trader’s primary tasks are to anticipate the market direction and to use proper strategy to maximize profits. Novice traders find it too difficult to understand the financial and technical jargon used in markets and confusing behavior of markets. Part time traders face time constraint to analyze the many factors influencing the markets. A simple and easy to follow checklist that enhances the probability of predicting the market direction can be useful to the traders who trade in indices in minimizing losses and earning decent returns. A sincere attempt has been made to develop a checklist consisting of only five significant data points so that both beginners and others can follow easily daily.
Many factors like results, central bank actions, government policies, national and international events etc impact the market movement. Many people bank on analyses like fundamental analysis, Dow theory, Elliot wave, candlesticks etc and parameters like price-volume, moving averages, technical indicators, put-call ratio and advance decline ratio etc. Some others follow market correlations with foreign markets, currency, gold and expert opinions etc. Others use various combinations of all these. Some of these factors are primary and some of them are derived.
To make trader’s life easier, five key factors that are easy to use and understand are selected that can broadly indicate the likely direction of movement. These factors also cover several of the above discussed data points. The factors considered in this checklist are technical summary on short and medium terms, FII/FPI/DII Buy/Sell action and opinion of two experts. Format of the checklist is as shown below.
How to use the above checklist and an example are discussed below.
Technical summary of moving averages and indicators in Short and Medium terms As traders are more interested in short and medium term movements, suitable time frames can be assumed based on their knowledge and type of trading like day trading/trend trading/till expiry etc. Technical summary of moving averages and indicators corresponding to these time frames can be obtained from either the software they use or public sources like investing.com. If the summary on both your time frames giving same signal one can expect market to proceed in that direction otherwise it is better to wait and watch.
Technical summary (investing.com)
I use data of 15 min and hourly timeframes for my trading.
Disclaimer: Analysis and expectations are based on known knows. Known unknowns and unknown unknowns may cause disruptions.


