
American Express Company (NYSE:AXP) reported adjusted earnings per share (EPS) of $1.47 beating the Zacks Consensus Estimate by a cent. However, earnings witnessed a sharp 30% year-over-year decline.
Better-than-expected results were mainly backed by a lower tax rate and the effect of share buyback. However, when comparing year-over-year, the bottom line suffered as the year-ago earnings reflected the $1.1 billion gain recorded from the sale of the Costco Wholesale Corp. (NASDAQ:COST) co-brand portfolio.
The company reaffirmed its earlier EPS guidance of $5.60–$5.80 for 2017.
Revenues came in at $8.3 billion, slightly ahead of the Zacks Consensus Estimate of $8.2 billion and up 1% year over year.
American Express Company Price, Consensus and EPS Surprise
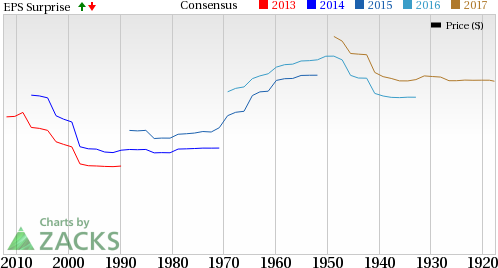
American Express Company Price, Consensus and EPS Surprise | American Express Company Quote
Notably, excluding the Costco-related business and the effect of foreign exchange rates, adjusted revenues climbed 8% driven by higher adjusted Card Member spending and net intere American Express acquired 2.7 million new card users globally and “card member spending grew 8%.”
Provisions for losses totaled $584 million, up 26% year over year, led by higher loans disbursed by the company and a higher loan write-off rate.
Total expenses of $5.8 billion increased 21% year over year due to higher rewards’ expenses as the company added new features to its products to woo and retain customers.
The effective tax rate was 31%, reflecting a decrease from 33% in the year-ago quarter. The tax rate declined due to higher earnings from a lower tax rate in the international market than in the prior-year.
Segment Results
American Express’ U.S. Consumer Services segment reported net income of $440 million in second-quarter 2017, plunging 59% year over year. Notably, the year-ago quarter included Costco-related revenues, expenses and gains related to the sale of its loan portfolio. Total revenue, net of interest expense, remained flat year over year at $3.2 billion.
International Consumer and Network Services’ net income amounted to $209 million, down 8% year over year. Total revenue, net of interest expenses, inched up 1% year over year to $1.4 billion, primarily driven by higher discount revenue, net interest income and net card fees. This was in part offset by contractual partner payment in the year-ago quarter.
Global Commercial Services’ net income of $500 million plummeted 13% year over year, primarily due to higher net income in the year-ago quarter that benefited from Costco-related revenues, and expenses and gains from the sale of the Costco portfolio. Total revenue, net of interest expenses, increased 3% year over year to $2.6 billion, primarily reflecting higher Card Member spending.
Global Merchant Services’ net income increased 15% year over year to $430 million in the reported quarter. Total revenue, net of interest expenses, remained flat year over year at $1.2 billion. The prior-year quarter included Costco-related revenues.
Corporate and Other reported net loss of $239 million compared with net loss of $229 million in the year-ago quarter.
American Express' return on average common equity (ROCE) was 21.7% as of Jun 30 2017, down 470 basis points year over year.
Recent Developments
The company comfortably cleared its 2017 capital plan for the Comprehensive Capital Analysis and Review by regulators. Consequently, it has increased quarterly dividend by 9.4% to 35 cents per share, and will buy back up to $4.4 billion of common shares over the next four quarters.
Our Take
Second-quarter results reflect gradual improvement in the company’s efforts to grow its client base, increase the issuance of new cards, and retain clients by offering them frills on cards. Its strength in the consumer and international business lines should continue to support growth.
Going forward, we expect to see favorable earnings performance by the company given that it will continue with its elevated spending on growth initiatives. Its efforts toward reducing the cost base and disciplined capital management will further support the bottom line.
Zacks Rank and Other Stocks
American Express carries a Zacks Rank #3 (Hold). Some better-ranked stocks in the same space are Visa Inc. (NYSE:V) and Euronet Worldwide, Inc. (NASDAQ:EEFT) . Each of these stocks carries a Zacks Rank #2 (Buy). You can see the complete list of today’s Zacks #1 Rank (Strong Buy) stocks here.
Visa will report fiscal-third quarter earnings today after the market closes. It surpassed earnings estimates in each of the last four quarters with an average positive surprise of 7.24%.
Euronet will report second-quarter earnings on Jul 25, after market close. It surpassed earnings estimates in one and met in two of the last four quarters with an average positive surprise of 0.81%.
3 Top Picks to Ride the Hottest Tech Trend
Zacks just released a Special Report to guide you through a space that has already begun to transform our entire economy...
Last year, it was generating $8 billion in global revenues. By 2020, it's predicted to blast through the roof to $47 billion. Famed investor Mark Cuban says it will produce ""the world's first trillionaires,"" but that should still leave plenty of money for those who make the right trades early. Download Report with 3 Top Tech Stocks >>
American Express Company (AXP): Free Stock Analysis Report
Euronet Worldwide, Inc. (EEFT): Free Stock Analysis Report
Costco Wholesale Corporation (COST): Free Stock Analysis Report
Visa Inc. (V): Free Stock Analysis Report
Original post