: 68.1%
VIX Status: 13.5
General (Short-term) Trading Call: Hold
Commentary
The S&P 500 (SPY) heads into the feared month of May right on the edge of overbought. Bulls took the burden of proof in stride and closed out April at fresh all-time highs. We also have a Federal Reserve meeting to start the month with fireworks.
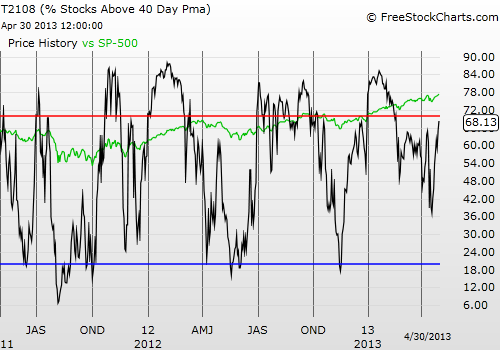
T2108 sits at 68.1%, right at the edge of being overbought. This is also day #10 with T2108 trading above the 40% threshold (the 40% “over-period”). The bias for S&P 500 performance at this juncture is becoming decidedly more negative IF this over-period were to end soon (click here for the explanatory chart). So, I will be inclined to buy SSO puts soon whether or not T2108 flips to official oversold (above 70%). Technical confirmation will be a lower close on the S&P 500, say below 1580. I have learned that using additional technical cues should improve my timing of entries and reduce triggers on false positives. Without such confirmation, I will let the S&P 500 ride for about another week before I return to a bullish bias. At THAT point, I will assume an extended (overbought) period has begun.
I conclude with two important charts: Apple (AAPL) and Amazon.com (AMZN). I need to write more complete pieces on both soon, but I offer up quick chart reviews as stand-ins until I can carve out the time. AAPL and AMZN almost look like stocks heading in opposite directions now.
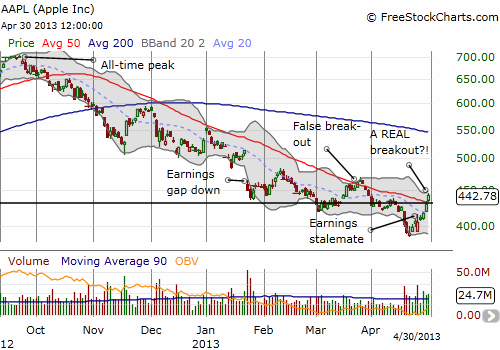
Apple (AAPL) broke through an extremely important resistance point with the convergence of the 50DMA and the former support turned resistance around $532. Buying volume has been solid since earnings, and it is looking more and more like AAPL has indeed printed an important bottom. Next clear resistance is at $470 where the last and ONLY breakout of the current downtrend from all-time highs flared out. Closing above that resistance would be a VERY bullish signal. Until then, AAPL is still in “show me” mode. Note that the current bullish run has also (of course) completely reversed the previous more bearish daily trading patterns that I noted in my last Apple update. This change in patterns has meant that I have not held call options as long as I should have and have ended up with too much hedging with put options (in other words, a LOT of money left on the table!). I will be re-evaluating the short-term trading strategy after about another week or so. I imagine Apple is likely to churn the closer it trades to its next resistance.
I think Apple’s bond issuance is a great move: replaces the need to repatriate cash at a high tax rate, and provides access to cheap funds for shareholders in the form of Apple turning those bonds into higher-yielding shares.
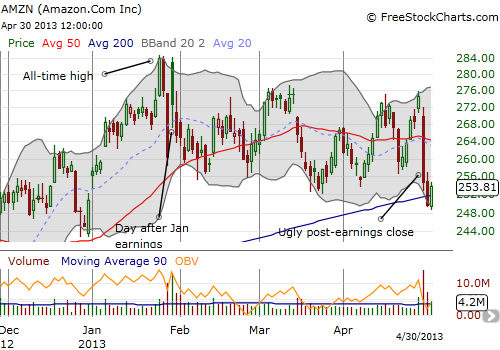
Amazon had a very poor post-earnings performance with a decline over 6%. By immediately breaking the low of that first post-earnings day, AMZN is officially in bearish post-earnings territory. The battle at the 200DMA highlights the drama. Given the poor open, I decided to wait before executing the typical AMZN post-earnings strategy to buy the open. That wait did not help much as my call options were of course crushed by the close of tradings. On Tuesday, I went with June put spreads to play what I think will be at least a rough two weeks, if not more, for AMZN.
I have updated the Google spreadsheet that tracks the post-earnings stats on AMZN. The last post-earnings trade was particularly treacherous because the stop-loss rule actually increased overall loss this time around, making it the second worst performance in the series. 
Black line: T2108 (measured on the right); Green line: S&P 500 (for comparative purposes)
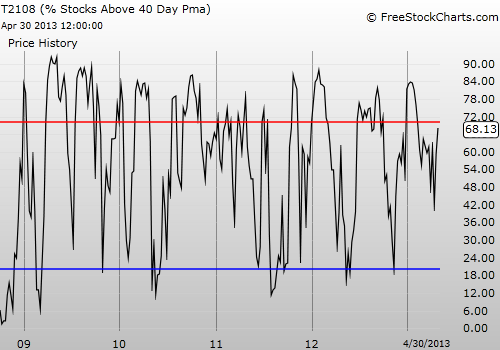
Red line: T2108 Overbought (70%); Blue line: T2108 Oversold (20%)
Be careful out there!
Full disclosure: long AAPL shares and puts, long AMZN calls and put spread
- English (UK)
- English (India)
- English (Canada)
- English (Australia)
- English (South Africa)
- English (Philippines)
- English (Nigeria)
- Deutsch
- Español (España)
- Español (México)
- Français
- Italiano
- Nederlands
- Português (Portugal)
- Polski
- Português (Brasil)
- Русский
- Türkçe
- العربية
- Ελληνικά
- Svenska
- Suomi
- עברית
- 日本語
- 한국어
- 简体中文
- 繁體中文
- Bahasa Indonesia
- Bahasa Melayu
- ไทย
- Tiếng Việt
- हिंदी
Almost Overbought: S&P 500
Published 05/01/2013, 08:14 AM
Updated 07/09/2023, 06:31 AM
Almost Overbought: S&P 500
T2108 Status
Latest comments
Loading next article…
Install Our App
Risk Disclosure: Trading in financial instruments and/or cryptocurrencies involves high risks including the risk of losing some, or all, of your investment amount, and may not be suitable for all investors. Prices of cryptocurrencies are extremely volatile and may be affected by external factors such as financial, regulatory or political events. Trading on margin increases the financial risks.
Before deciding to trade in financial instrument or cryptocurrencies you should be fully informed of the risks and costs associated with trading the financial markets, carefully consider your investment objectives, level of experience, and risk appetite, and seek professional advice where needed.
Fusion Media would like to remind you that the data contained in this website is not necessarily real-time nor accurate. The data and prices on the website are not necessarily provided by any market or exchange, but may be provided by market makers, and so prices may not be accurate and may differ from the actual price at any given market, meaning prices are indicative and not appropriate for trading purposes. Fusion Media and any provider of the data contained in this website will not accept liability for any loss or damage as a result of your trading, or your reliance on the information contained within this website.
It is prohibited to use, store, reproduce, display, modify, transmit or distribute the data contained in this website without the explicit prior written permission of Fusion Media and/or the data provider. All intellectual property rights are reserved by the providers and/or the exchange providing the data contained in this website.
Fusion Media may be compensated by the advertisers that appear on the website, based on your interaction with the advertisements or advertisers.
© 2007-2024 - Fusion Media Limited. All Rights Reserved.
