
In the past week, American Airlines (NASDAQ:AAL) revised its projection on total revenue per available seat mile (TRASM: a key measure of unit revenues) for third-quarter 2019. Despite the negative impact of Hurricane Dorian, the new projection was impressive and consequently found favor with investors. American Airlines also extended the grounding period of Boeing 737 MAX jets in its fleet by more than a month. The carrier has 24 such jets in its fleet.
Latin-American carrier GOL Linhas (NYSE:GOL) also provided an upbeat view pertaining to third-quarter passenger unit revenues (PRASK) backed by a strong demand for air travel. GOL Linhas is scheduled to release its third-quarter 2019 results on Oct 31. Also, Azul (NYSE:AZUL) grabbed headlines owing to its upbeat September traffic report. Azul’s decision to start operations on the busy Rio de Janeiro-São Paulo routefrom Aug 29, 2019, aided traffic report.
Meanwhile, Southwest Airlines (NYSE:LUV) suspended operations for two Boeing 737 Next Generation (NG) jets in its fleet after finding cracked parts in them. The low-cost carrier has reported its findings to Boeing and the Federal Aviation Administration (FAA).
(Read the last Airline Stock Roundup here).
Recap of Past Week’s Most Important Stories
1. American Airlines now expects third-quarter 2019 TRASM to increase between 1.5% and 2.5% (old guidance: increase in the 1-3% band). The raised guidance is primarily based on higher yields. Non-fuel unit costs are still expected to increase between 4% and 6%. Pre-tax margin, excluding special items, is projected in the range of 6.5-7.5% for the to-be-reported quarter (old guidance: 5.5-7.5% range). Additionally, fuel costs are now estimated between $2.03 and $2.08 per gallon for the September quarter (old guidance: $2.05-7$2.10 range).
The carrier, which canceled 9,475 flights in the July-September period due to the Boeing 737 Max groundings, expects the cancellations to hurt its pretax income to the tune of approximately $140 million in the to-be-reported quarter. American Airlines extended the grounding period of such jets until Jan 15, 2020 from Dec 3, 2019, expected earlier. The impact of the extension on its current-year pre-tax earnings will be disclosed by the carrier on its third-quarter conference call. The carrier expects available seat miles (a measure of capacity) to be approximately 70.1 billion in the final quarter of 2019.
2. GOL Linhas, carrying a Zacks Rank #2 (Buy), expects air traffic, measured in revenue passenger kilometers (RPK), to rise approximately 12.8% year over year in the September quarter. Owing to this tailwind, passenger unit revenues are anticipated to increase approximately 20%. Additionally, total unit revenue (RASK) is estimated to climb nearly 19% in third-quarter 2019. While total capacity is predicted to increase approximately 7.6%, the total number of seats are estimated to go up nearly 7.8%.(Read more: Gol Linhas Buoyed by Robust Demand Expects Solid Q3 PRASK)
You can see the complete list of today’s Zacks #1 Rank (Strong Buy) stocks here.
3. At Azul, consolidated traffic (measured in revenue passenger kilometers or RPKs) for September increased 31% year over year to 2.55 billion owing to 34.9% growth on the domestic front and 18.9% rise internationally. On a year-over-year basis, consolidated capacity (measured in available seat kilometers/ASKs) expanded 30.8% to 3.06 billion mainly due to a 35.7% rise in domestic capacity.
With growth in consolidated traffic outpacing capacity expansion, consolidated load factor (percentage of seats filled by passengers) improved 0.1 percentage points to 83.3%. The increase in this key metric was due to the 2.7 percentage point increase in the international load factor to 87.7%. (Read more: Azul's Traffic and Load Factor Increase in September)
4. September traffic at Hawaiian Holdings’ (NASDAQ:HA) subsidiary — Hawaiian Airlines — increased 3% to 1.49 billion. Available Seat Miles inched up 0.7% to 1.74 billion in the same month. Load factor improved 190 basis points to 85.5%. During the first nine months of 2019, the carrier recorded a 2.9% rise in RPMs while ASMs increased 1.6%.
Moreover, the carrier’s updated view on operating revenue per available seat miles (RASM) for the September quarter, which is highly encouraging. Detailed results should be out on Oct 22. The carrier now expects RASM to vary in the - 0.5% - +0.5% range (previously the metric was expected to decline between 1.5% and 4.5%). The improved view can be attributed to better-than-expected yields in long-haul markets, particularly in its international entity. Non-fuel unit costs are expected to increase between 4.5% and 5.5% (old guidance: 3.5-6.5% range). Additionally, fuel costs are now estimated to be $2.04 per gallon for the September quarter (old guidance: $2.11).
5. While complying with the FAA’s directive to inspect Boeing 737 NG jets involved in at least 30,000 flights, Southwest Airlines detected cracks in two such jets in its fleet. The concerned jets have been removed from operations until the issue is resolved. Reportedly, the cracks were detected in a part called a pickle fork. Pickle forks refer to parts that connect the plane's wings to its fuselage. Notably, Boeing is replacing NG planes with 737 MAX jets. Southwest Airlines has 34 737 MAX jets in its fleet, which are currently grounded. In fact, the Southwest Airlines Pilots Association sued The Boeing Company (NYSE:BA) , accusing the plane manufacturer of having "deliberately misled" the carrier and pilots about the 737 MAX jets.
Performance
The following table shows the price movement of the major airline players over the past week and during the last six months.
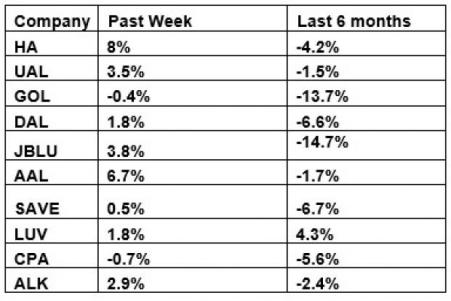
The table above shows that most stocks traded in the green over the past week, leading to the NYSE ARCA Airline Index gaining 3% to $99.39. Shares of Hawaiian Holdings appreciated the most following the bullish RASM guidance. Over the course of six months, the NYSE ARCA Airline Index depreciated 5.6%.
What's Next in the Airline Space?
Investors will look forward to third-quarter 2019 earnings report of United Airlines (NASDAQ:UAL) , scheduled to be released on Oct 15.
5 Stocks Set to Double
Each was hand-picked by a Zacks expert as the #1 favorite stock to gain +100% or more in 2020. Each comes from a different sector and has unique qualities and catalysts that could fuel exceptional growth.
Most of the stocks in this report are flying under Wall Street radar, which provides a great opportunity to get in on the ground floor.
Today, See These 5 Potential Home Runs >>
Hawaiian Holdings, Inc. (HA): Free Stock Analysis Report
American Airlines Group Inc. (AAL): Free Stock Analysis Report
Southwest Airlines Co. (LUV): Free Stock Analysis Report
United Airlines Holdings Inc (UAL): Free Stock Analysis Report
Gol Linhas Aereas Inteligentes S.A. (GOL): Free Stock Analysis Report
The Boeing Company (BA): Free Stock Analysis Report
AZUL SA (AZUL): Free Stock Analysis Report
Original post
Zacks Investment Research