What a week! Stocks really took it on the chin last week, but by Friday there was some semblance of stability. Several indicators are in deep oversold territory. At least a reflex rally is due.
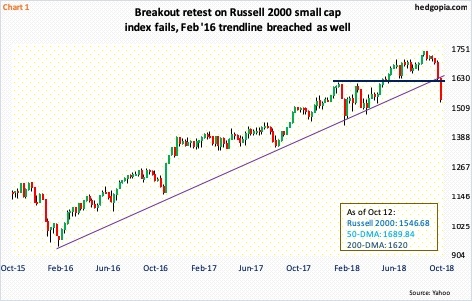
During the carnage over the last couple of weeks, the Russell 2000 small cap index (1546.68) was the one to sustain the maximum damage. Last week, it collapsed 5.2 percent, and was down as much as 6.2 percent intraday Friday. In the process, a rising trend line from February 2016 has been lost (Chart 1). Also gone is major horizontal support at 1610-ish, not to mention 50- and 200-day moving averages. To add insult to injury, a potentially bearish MACD cross-under just developed on the monthly. Medium- to long-term, more downside pressure probably lies ahead. Near-term is another matter.
The amount of selling over the last two weeks has pushed several momentum indicators into deep oversold territory, particularly on a daily basis. Friday, the Russell 2000 was only up 0.1 percent, but produced a long-legged doji. Small-cap bulls are beginning to put their foot down.
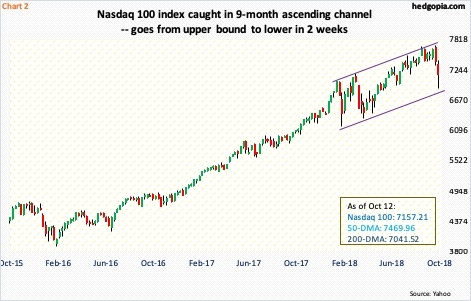
Similar dynamics are in play on the Nasdaq 100 index (7157.21). Last week, it shed 3.3 percent. At its worst, it was down as much as 6.8 percent. Before last Friday’s 2.8-percent rally and recapturing of the 200-day, it lost several short-term horizontal support including 7300 as well as the 50-day. Amidst this tumult, last Friday produced a hammer reversal candle right on the 200-day. The index is also caught in a nine-month ascending channel (Chart 2). Two weeks ago, it was once again rejected at the upper bound, and last Friday it just about tagged the lower bound. The path of least resistance is a move higher toward the upper bound. Conditions are oversold and favorable for a move higher. Nearest resistance lies at 7300.
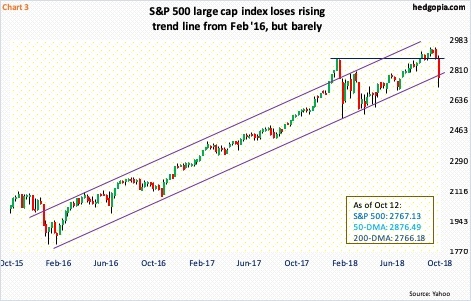
Over on the S&P 500 large cap index (2767.13), amidst the recent breakdown, there is a similar bull-bear tug of war around the 200-day. By Thursday, the average was handily lost, but Friday’s 1.4-percent bounce put the index right on the 200-day. Similarly, a rising trend line from February 2016 was lost earlier, but by Friday the damage was pretty much repaired (Chart 3).
Medium- to long-term, there is plenty of room for weekly and monthly indicators – particularly the latter – to continue lower. Near term, conditions are oversold. Thursday, the percent of S&P 500 stocks above the 50-day dropped to 11 percent. This is low, and the lowest since nine percent in January 2016. Also Thursday, the same metric on the Nasdaq 100 fell to a mere six percent; back in January 2016, it dropped as low as three percent. These are very low readings and reflect a lot of pessimism. To recall, US stocks reached a major bottom in February 2016.
On the S&P 500, bulls need to recapture 2800 as soon as possible to enhance their odds.
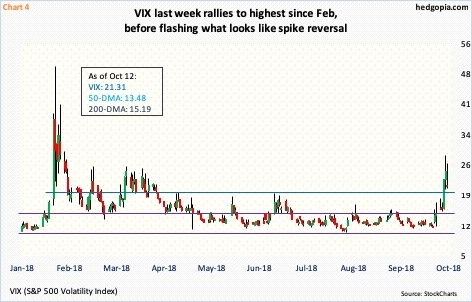
VIX had a mini-spike last week. The last time it had a stronger spike, followed by a reversal, was early February, when VIX surged intraday to 53.30 on the 6th. Last week, the jump in the volatility index was nowhere near as strong, but in terms of flashing a potentially reversal signal it was.
Thursday, VIX rallied to 28.84 intraday, but only to close at 24.98. Again on Friday, it jumped to 26.80 intraday but closed at 21.31. Both those sessions produced long upper shadows (Chart 4). On the daily chart in particular, VIX is way overbought. Unwinding is only natural near term. There is support at just under 20 and under 15 after that. The 200-day rests at 15.19. The 50-day (13.48) is gradually beginning to curl up.
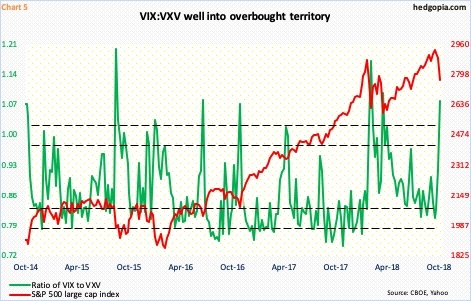
In the meantime, the ratio of VIX to VXV is well into overbought territory.
VIX measures market’s expectation of 30-day volatility on the S&P 500. VXV does the same except it goes out to three months. As near-term volatility shoots up, VIX:VXV rises, which was the case of late. As things calm down and premium comes out of shorter-term volatility, the ratio drops, which should be occurring in the sessions/weeks ahead.
Friday, the ratio closed at 1.07 (Chart 5). But on Thursday when VIX had that spike reversal the ratio jumped as high as 1.22 intraday. Trader nerves were elevated, and this needs to get unwound. Ideally, the ratio can drop to high 0.70s to low-0.80s. Should things evolve this way, this should bode well for stocks.
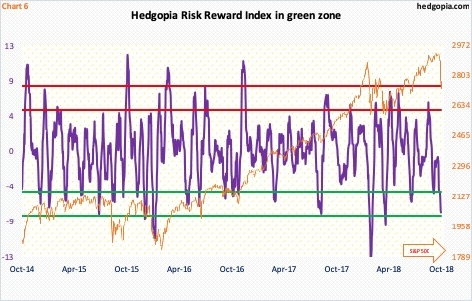
The Hedgopia Risk Reward Index (HRRI) is sending the same message. It is designed to capture short-term swings. Friday, HRRI pushed further into the green zone. This can always continue lower – further into oversold territory. As Chart 6 shows, it has done so in the past. But once it drops into the green zone, risk-reward odds favor going long more than going short.
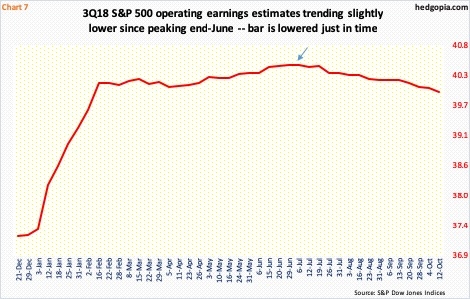
It is possible the reversal in equities last Friday was helped by short-covering. But this alone is not going to cut it. Yes, conditions are oversold technically, but for that to begin to unwind, bulls need to step up to the plate. The 3Q18 earnings season just got underway, and that just might act as one of the triggers. For one, stocks have sold off into reporting. Second, the bar is lower than just a few weeks ago.
Operating earnings estimates for 3Q18 for S&P 500 companies were $40.47 when the quarter began (arrow in Chart 7). Last Friday, they were $39.97. The $0.50-drop is not a whole lot, but from the standpoint of companies meeting/beating estimates, every bit helps.
Put this all together, it increasingly looks like, as things stand, it is risky to stay short.
Hypothetically on August 13, SPY (SPDR S&P 500 ETF (NYSE:SPY)) was shorted in combination with a short put at an effective price of $283.80. This was then followed by another weekly short put that further raised the short price to $284.35. Before that on July 30, a short QQQ (Invesco QQQ Trust) position was combined with a covered put for an effective short price of $178.48. Friday, SPY closed at $275.95 and QQQ at $174.32. Covering these shorts nets $8.40 and $4.16 respectively.
Concurrently, it is also advisable thinking about going long or at least beginning to position oneself to go long. In options, SPY October 26th 275 puts sell at $3.78. It is a naked short put, so a little risky. A spread can reduce the risk but also earns less in premium. Given the selling over the past couple of weeks, last week’s lows can be used as a good reference point – at least near term. If put, it is a long at $271.22. Risk-reward odds are decent.
Thanks for reading!

