Semiconductor company Advanced Micro Devices (NASDAQ:AMD) stock has been both a pandemic winner and a recovery play as it reached all-time highs in 2020. However, shares but have been struggling in 2021 with a (-3.82%) performance year-to-date (YTD) versus 1.2% for the benchmark S&P 500 index. AMD is even underperforming the semiconductor sector which is up 7.78% YTD, as of Jan. 16, 2021.
The surge in bitcoin (BTC) prices has caused a run and shortage of application specific integrated circuit (ASIC) mining rigs. Major bitcoin miningplayers like Marathon Patent (NASDAQ:MARA) and Riot Blockchain (NASDAQ:RIOT) have preordered hundreds of millions dollars’ worth of ASIC Antminers from Bitmain and MicroBT, the world’s largest suppliers.
Since the Q3 2020 earnings release, shares of bitcoin have nearly tripled which unquestionably bolstered demand for GPUs. Prudent investors seeking exposure in the growing trend of cryptocurrency mining can monitor AMD for opportunistic pullback levels, especially in light of recent pullbacks from the surprise Intel (NASDAQ:INTC) CEO announcement.
ASIC vs. GPU mining
ASIC rigs are designed specifically for a single type of cryptocurrency/algorithm. ASIC miners are most effective for mining bitcoin specifically, but the shortage of high-end ASIC rigs is bolstering demand for graphic-processing-unit (GPU) mining rigs. GPU mining requires high-end graphic cards manufactured primarily by AMD and NVIDA (NASDAQ: NVDA). GPU mining is superior in terms of flexibility to mine other cryptocurrencies that also have ASIC resistance including Ethereum, Litecoin, Dogecoin and Vertcoin gain more attention with rising values. The hardware supply constraint for bitcoin mining components as well as the ASIC resistance is a boon for GPU mining components demand, which should be a boon to AMD.
Q3 FY 2020 Earnings Release
On Oct 27, 2020, AMD released its fiscal third-quarter 2020 results for the quarter ending September 2020. The Company reported an earnings-per-share (EPS) profit of $0.41 excluding non-recurring items versus consensus analyst estimates for a profit of $0.30, a $0.10 beat. Revenues grew 55.5% year-over-year (YoY) to $2.8 billion beating analyst estimates for $2.56 billion. The Company raised Q4 2020 revenue guidance to come in the range of $2.90 billion to $3.10 billion versus $2.62 billion consensus analyst estimates with gross margins expected around 45%. The Company will also acquire Xilinx (NASDAQ:XLNX) for $35 billion in stock.
Intel Scores New CEO
On Jan. 13, 2021, Intel confirms the appointment of a new CEO Pat Gelsinger replacing Bob Swan on Feb. 15,2021. Gelsinger was the CEO VMware (NYSE:VMW) since 2012. Intel also raised its Q4 EPS guidance to come in higher than the $1.10 consensus analyst estimates and revenues to also come in higher than the $17.40 billion projected, which fell short of the $17.45 billion consensus analyst estimates. Intel shares collapsed on its prior Q3 2020 release but saw a surge on this announcement. In the meantime, shares of AMD plunged.
Bitcoin Explosion Likely Not Factored into Q4 2020 Guidance
Since the Q3 2020 earnings period ending in September 2020, the price of bitcoin nearly tripled from the $10,000 range to peak at $42,000 range. The momentum flowed into most of the major cryptocurrencies spurring massive demand in GPUs, which likely wasn’t expected nor factored into the raised Q4 guidance. This could not only result in a surprise blowout, but further guidance raise moving forward as crypto mining accelerates GPU demand in 2021. Prudent investors looking to capitalize on this potential upside surprise can watch for opportunistic pullback levels to gain exposure.

AMD Opportunistic Pullback Levels
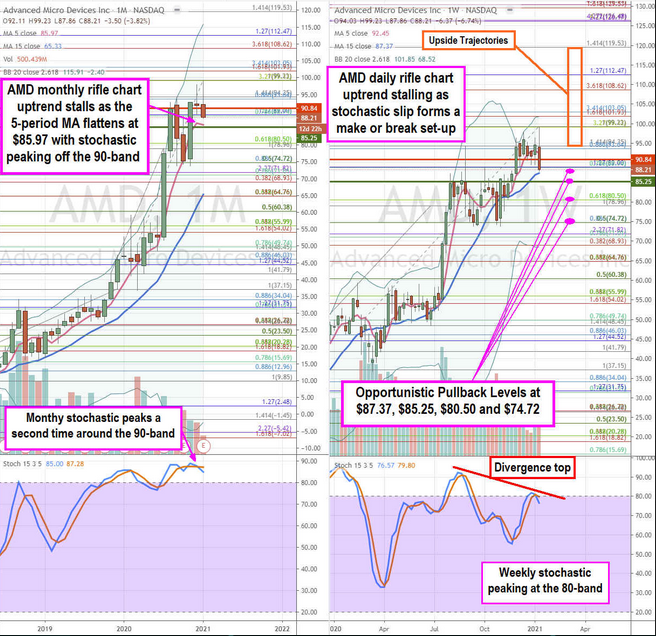
Using the rifle charts on the monthly and weekly time frames provides a broader view of the price action playing field for AMD stock. The monthly rifle chart has been in a strong uptrend but is flattening out as the 5-period moving average (MA) support flattens out at $85.97 as the 15-period MA overlaps the $64.76 Fibonacci (fib) level. The monthly stochastic peaked again off the 90-band turning back down but still above the 80-band. The weekly rifle chart has also stalled out after peaking at the $99.23 fib. The weekly market structure low (MSL) buy triggered above $85.25 in October 2020. However, the weekly market structure high (MSH) sell trigger formed below $90.84. The weekly stochastic crossed back down off the 80-band suggesting a further oscillation down upon forming a divergence top. This can provide prudent investors with opportunistic pullback levels at the $87.37 weekly 15-period MA, $85.25 weekly MSL trigger, $80.50 fib, and the $74.72 fib. The upside trajectories range from the $94.25 fib to the $119.53 fib.
