
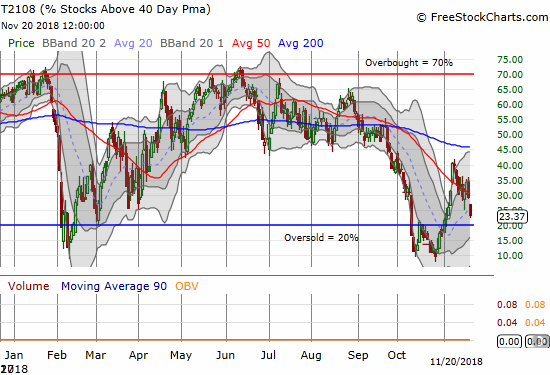
The technical damage continues in the stock market. Amid all the carnage and massive gap downs, I am surprised AT40 (T2108), the percentage of stocks trading above their respective 40-day moving averages (DMAs) is still above the threshold for oversold trading conditions (20%). My favorite technical indicator closed at 23.4%. In the last oversold period, T2108 closed as low as 9.7%.
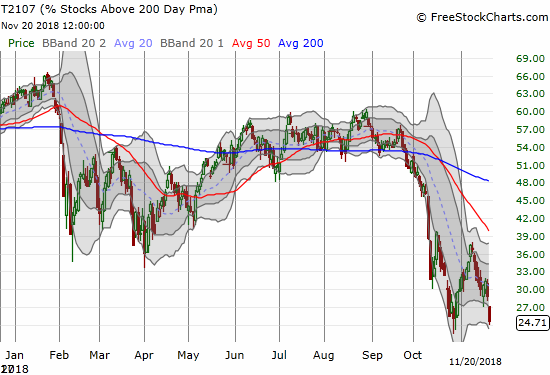
While the stock market is not technically oversold, AT200 (T2107), the percentage of stocks trading above their respective 200DMAs, closed below its lows from October. AT200 hit a new 32-month low and a new extreme (note that AT200 dropped to the single digits during the early 2016 sell-off). This important low means that money managers are once again looking at broad damage in their portfolios. A large share of those stocks are trading in bearish territory and look like sells into the next rally. AT200’s return to these levels confirms the lasting technical damage slamming the stock market.
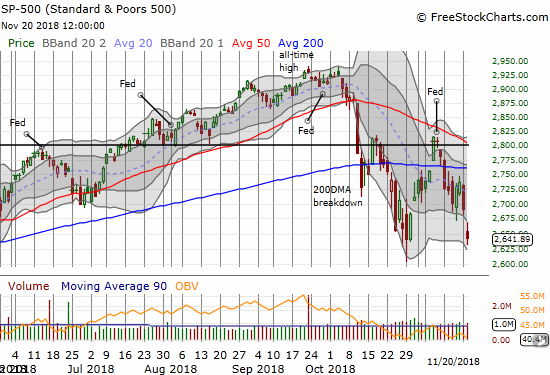
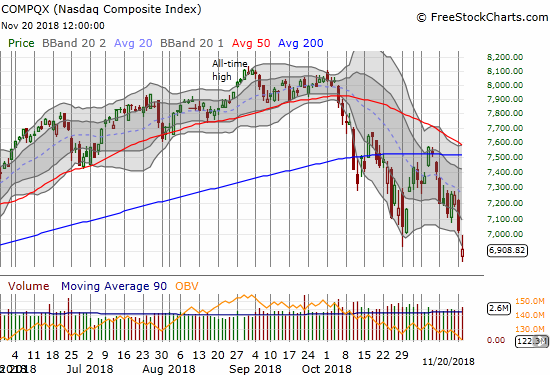
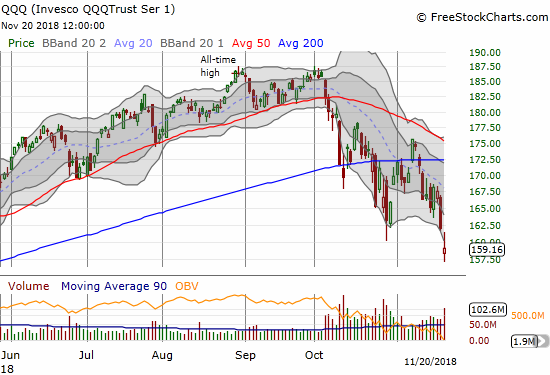
The charts of the major indices say plenty. The S&P 500 lost 1.8% and closed exactly at the October low and the low of the last oversold cycle. The index is down 1.2% year-to-date. The NASDAQ lost 1.7% to close at a 7-month low and is now flat year-to-date. The Invesco QQQ Trust Series 1 (NASDAQ:QQQ) lost 1.8% to close at its own 7-month low. QQQ is still UP 2.2% year-to-date.
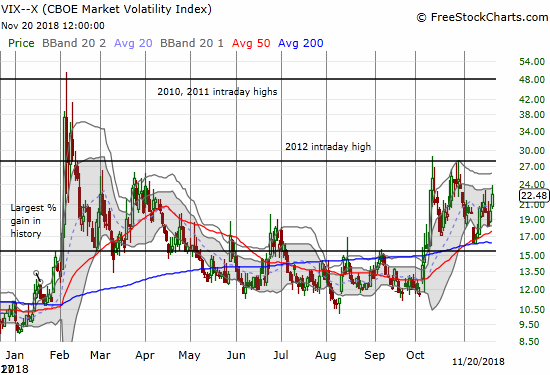
The volatility index, the VIX gained 11.8% to close at 22.5. The VIX surprisingly is not already back to its highs from the previous oversold periods. If someone told me about the large gap downs the market experienced on the day, I would have assumed the VIX was soaring right past the previous highs. I decided to buy a fresh tranche of put options on ProShares Ultra VIX Short-Term Futures (NYSE:UVXY) given the decent odds the VIX may already be topping out.
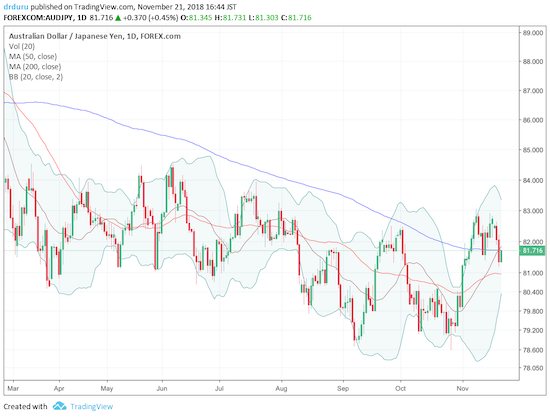
The Australian dollar (NYSE:FXA) versus the Japanese yen (NYSE:FXY) is, surprisingly, nowhere near its recent low. Combined with AT40 versus AT200 and the VIX, this positioning tempts me to think that the stock market is near a low for this latest selling cycle. Note that part of the lift is coming from recent bullish economic news.
The stock market is in desperate need of positive catalysts to break out of this cycle of selling. While the relative gulf between AT200 on one side and AT40 and the VIX on the other side looks like a potential kind of bullish divergence, I am keeping the short-term trading call at neutral. I downgraded all the way from bullish to neutral because of the 200DMA breakdown for the S&P 500. Today’s selling just confirmed that trading call. I am assuming the healing process for this technical damage needs to happen in oversold territory. By trading rule, I will flip back to bullish if AT40 drops below 20%.
CHART REVIEWS
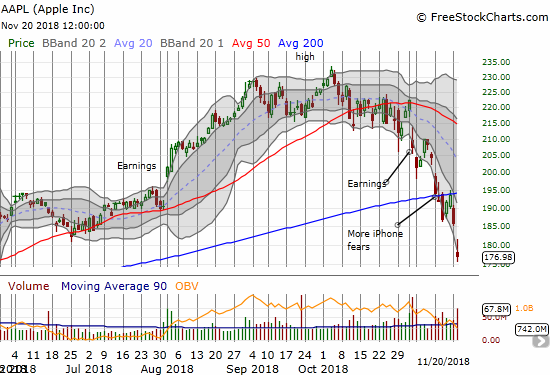
Apple (NASDAQ:AAPL)
AAPL is the poster child for this sell-off. The stock provided relative safety in October. In November, the stock is weighing the market down. The selling this week confirmed 200DMA resistance and gapped AAPL back to a 6-month low. While AAPL has yet to retest its 2018 lows for the year, this selling is much worse with the stock off a whopping 23.7% from its all-time high. AAPL also finished wiping out the gains from its big May breakout.
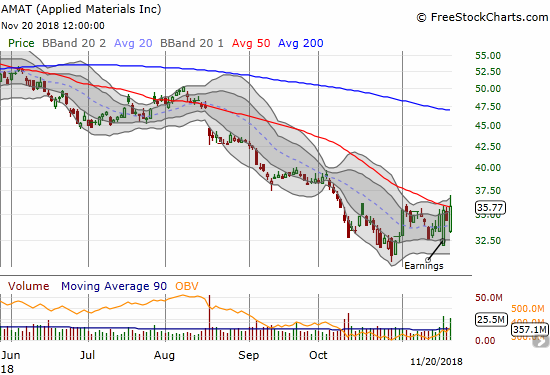
Applied Materials (NASDAQ:AMAT)
AMAT is still attracting my interest. The stock actually made a new post-earnings high and managed to break out above its 50DMA. I am a buyer if it moves up from here.
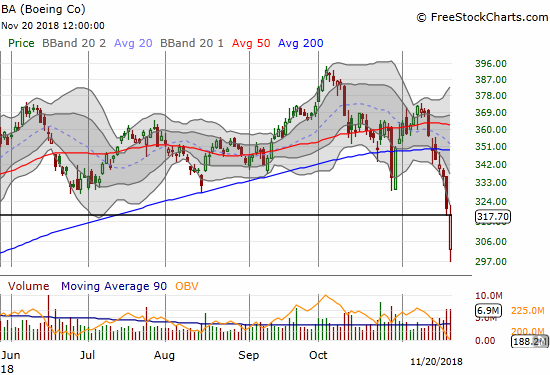
Boeing (NYSE:BA)
I chose a very bad time to put my Boeing-skepticism on pause. My call option play was quickly wiped out, and I can only imagine the gains if I had stuck to my previous approach of using BA puts as a hedge against other longs (fortunately I DID have two fists full of puts on Caterpillar (NYSE:CAT)). BA hit an intraday low of $296.61 which perfectly tested the stock’s big launch point that started 2018. At that point, BA was down 14.0% in the 4 days since closing below its 200DMA. BA is a broken stock.
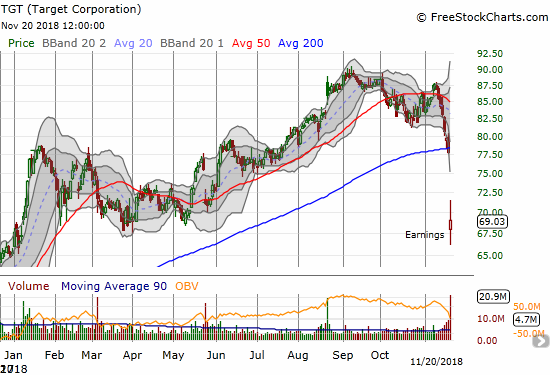
Target (NYSE:TGT)
Big box retailers continue to lose big. TGT lost 11.3% post-earnings to close right around the lows for 2018. Normally, I would jump in and buy TGT back here, but I think it is at best a trade for a dead cat bounce back to the lower Bollinger® Band (BB) and out of the current over-stretched condition.
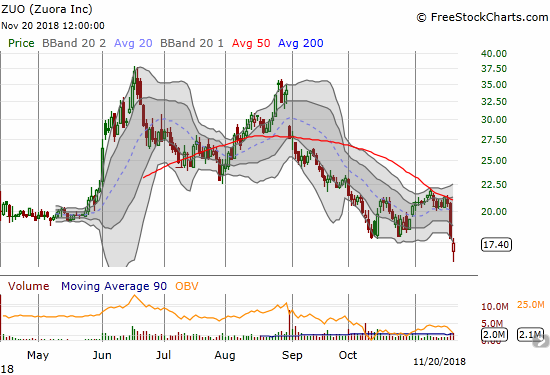
Zuora (ZUO)
The market is beating up on cloud stocks again. The chart of ZUO is a perfect homage to the most recent crop. The stock made a steep double top shortly after its IPO. In October, the stock made post-IPO lows. On Monday, the stock lost in one day what took two weeks to rebuild from the October low. Today, ZUO bounced back from a massive gap down but buyers could not avoid a new post-IPO low.
“Above the 40” uses the percentage of stocks trading above their respective 40-day moving averages (DMAs) to assess the technical health of the stock market and to identify extremes in market sentiment that are likely to reverse. Abbreviated as AT40, Above the 40 is an alternative label for “T2108” which was created by Worden. Learn more about T2108 on my T2108 Resource Page. AT200, or T2107, measures the percentage of stocks trading above their respective 200DMAs.
Active AT40 (T2108) periods: Day #14 over 20%, Day #1 under 30% (underperiod ending 3 days over 30%), Day #8 under 40%, Day #42 under 50%, Day #58 under 60%, Day #111 under 70%
Daily AT40 (T2108)")
Black line: AT40 (T2108) (% measured on the right)
Red line: Overbought threshold (70%); Blue line: Oversold threshold (20%)
Weekly AT40 (T2108)
*All charts created using freestockcharts.com unless otherwise stated
Be careful out there!
Full disclosure: long SSO, long SPY (NYSE:SPY) calls, long BA calls, long AAPL calls, long UVXY puts, long VXX calls, long AUD/JPY
*Charting notes: FreeStockCharts.com stock prices are not adjusted for dividends. TradingView.com charts for currencies use Tokyo time as the start of the forex trading day. FreeStockCharts.com currency charts are based on Eastern U.S. time to define the trading day.