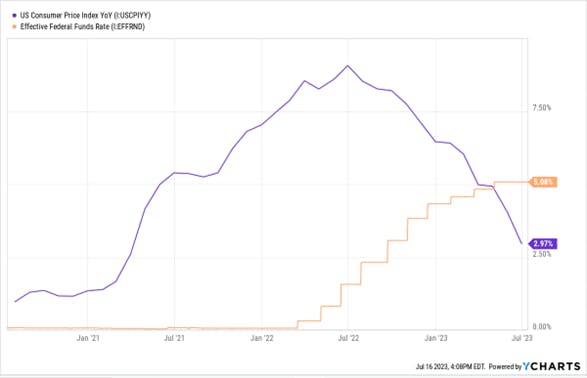
The first half of the year has been shaped by various market moving events – stubborn inflation, rising interest rates, banking failures, and a US debt ceiling crisis – that gave investors cause for concern. However, despite the occurrence of these events, the performance of US equities during this period, as evidenced by the S&P 500 Index, has been exceedingly strong, especially when placed in a historical context.
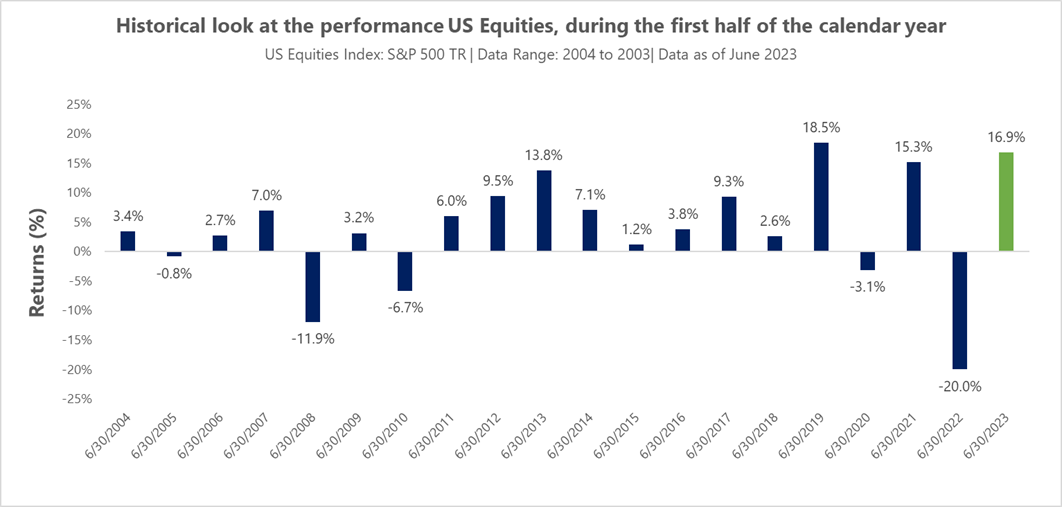
As evidenced from the chart above, among first half of the year performances for the S&P 500 Index over the past two decades, this year’s 16.9% ranks as the second best. The strong performance currently occurring within the US equities space is noteworthy, given last year’s cross-sectoral declines and the negative sentiment that has permeated the global economic environment this year.
Looking below the surface
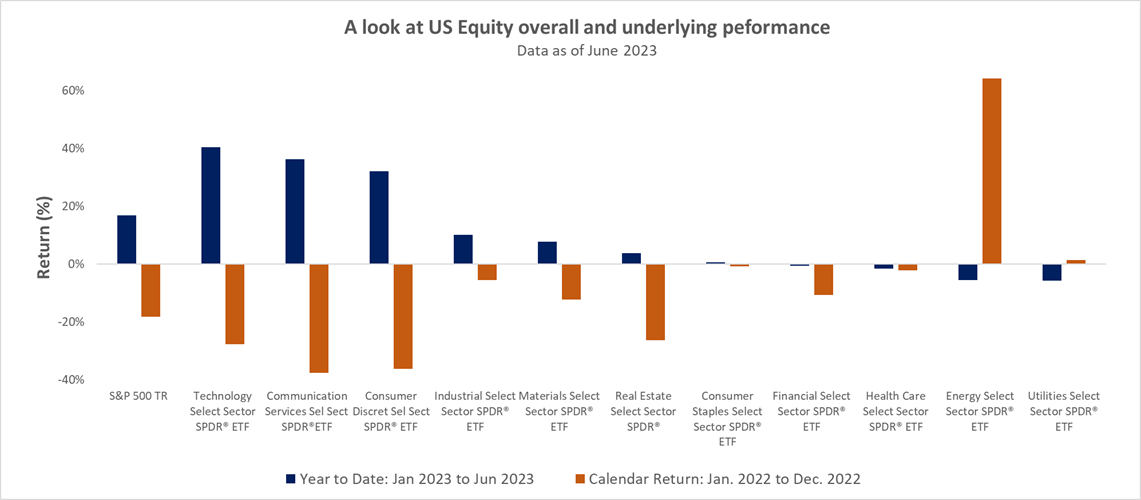
In looking at the underlying performance of the S&P 500 Index, the strong performance of the US equities asset class is being driven by three sectors, namely, Technology, Communication Services, and Consumer Discretionary – but the focus is being given to the technology sector, due to the strong performance of the group of companies dubbed ‘The Magnificent Seven’.
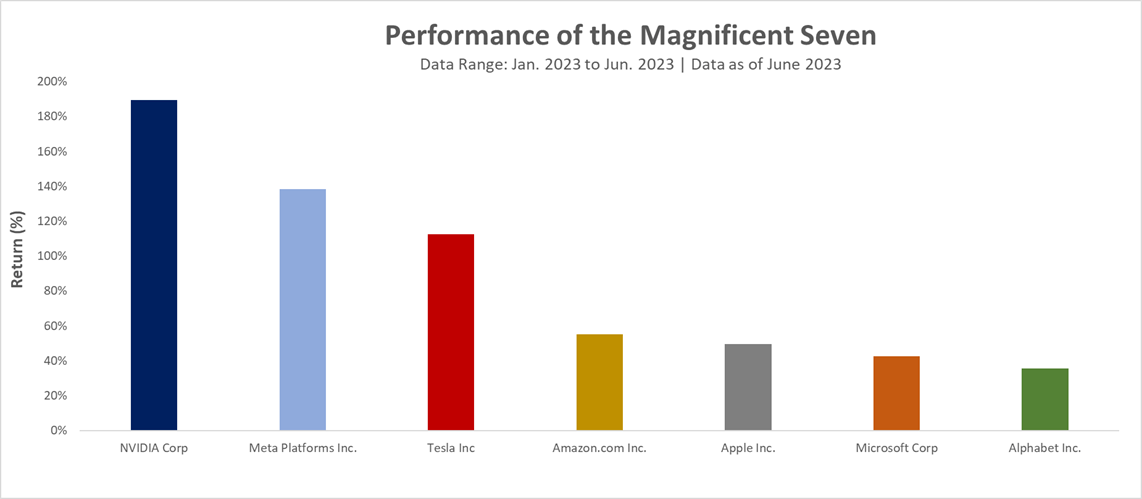
The ‘Magnificent Seven’ is comprised of Apple (NASDAQ:AAPL), Microsoft (NASDAQ:MSFT), Alphabet (NASDAQ:GOOGL), Amazon (NASDAQ:AMZN), Nvidia, Tesla (NASDAQ:TSLA), and Meta Their performance during the first half of the year has been truly noteworthy. As observed from the chart, the performance of NVIDIA Corp (NASDAQ:NVDA) has been exceptional, as the fervor around Artificial Intelligence has pushed the company to new heights, with it now having a $1 trillion market capitalization. As mentioned in a previous article, the company’s last quarterly earnings report noted that over $2 billion in profit was generated for the reporting period. Regarding Meta Platforms, progress in improving ad efficiency and the utilization of AI tools has increased monetization efficiency across their family apps. With the recent launch of Threads, the firm is looking to broaden its app ecosystem and strengthen its dominance as the premier social media platform provider.
As electric vehicle adoption moves toward normalcy, Tesla continues to find avenues to assert their industry leadership. Announced earlier this year, General Motors (NYSE:GM) will follow a similar action employed by Ford Motor (NYSE:F) and partner with Tesla to use their North American charging network and technologies. This partnership will allow GM to access Tesla’s 12,000 fast chargers using an adapter and GM’s EV charging app, starting in 2024.
GM, like Ford, will also begin installing a charging port used by Tesla known as NACS, or the North American Charging Standard, instead of the current industry-standard CCS, in its EVs starting in 2025.
The partnership among the auto manufacturers is a major win for Tesla, as it solidifies their charging technology as the preeminent leader within the EV space. This deal is also beneficial for consumers, particularly those that may have range anxiety regarding the use of an electric vehicle, as they now have the confidence that they will be able to charge their vehicles within Tesla’s expansive network.
While the performance of Amazon, Apple, Microsoft, and Alphabet may not be as pronounced as the previous three firms, their year-to-date returns, as of June 2023, have still been very impressive, relative to the broader market.
Safety in size & growth
The performance of the Magnificent Seven, against the backdrop of an uncertain macroeconomic environment, has highlighted the strength of large-cap growth-oriented firms. As seen in the following chart, the performance of the Russell 1000 Growth TR Index has significantly outperformed other segments thus far in 2023.
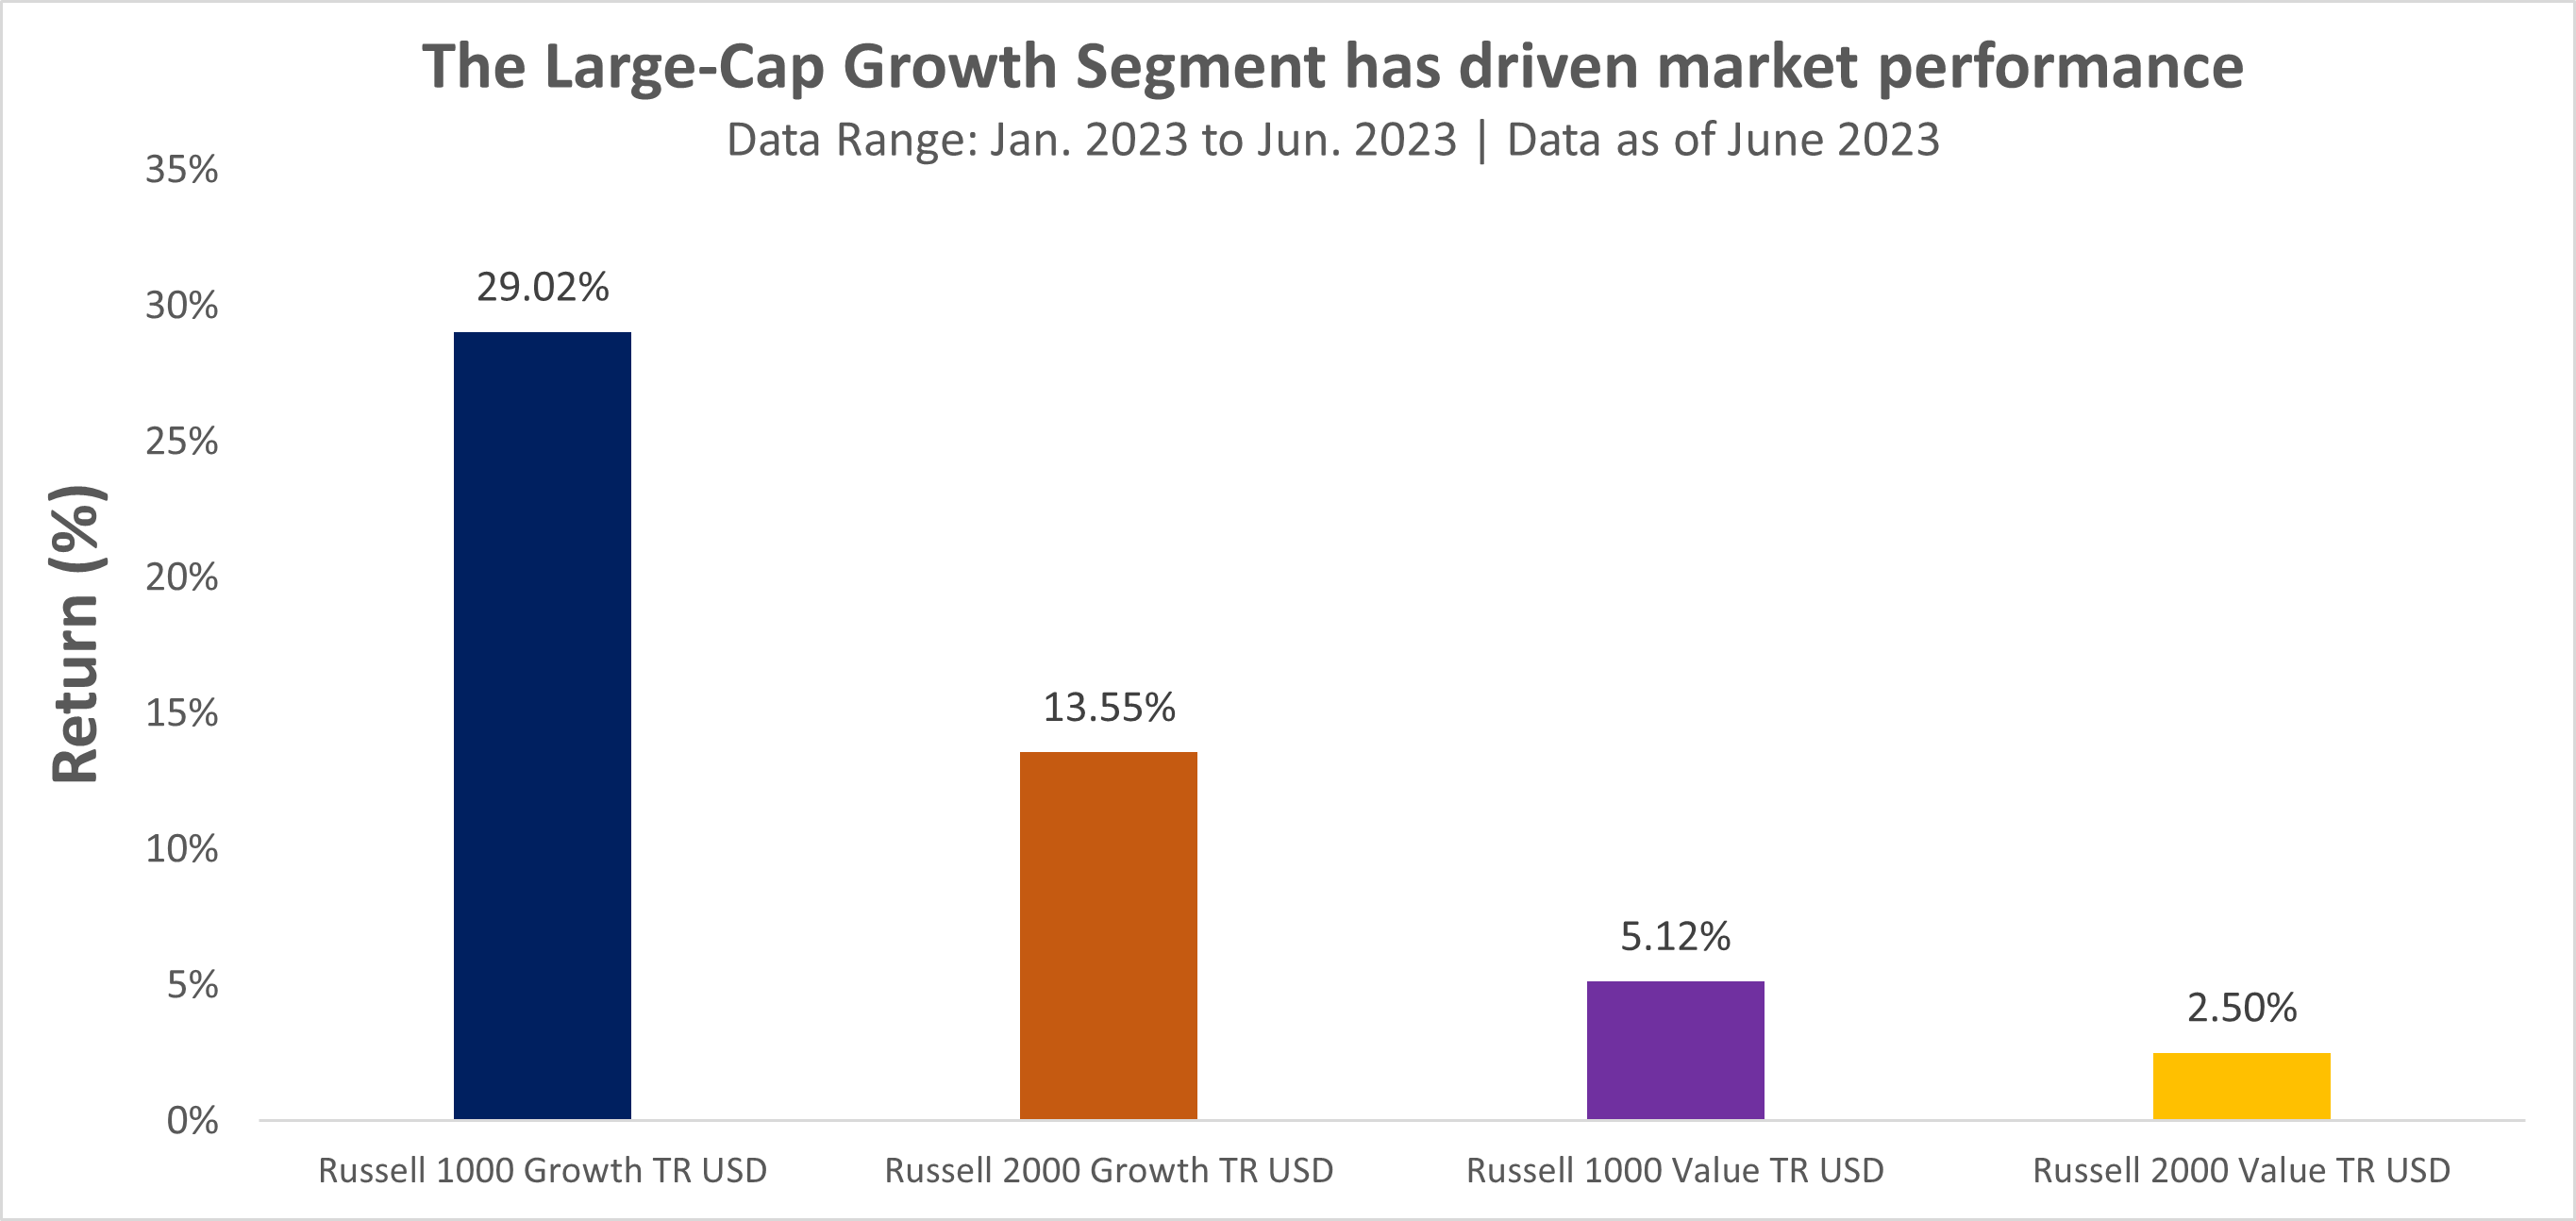
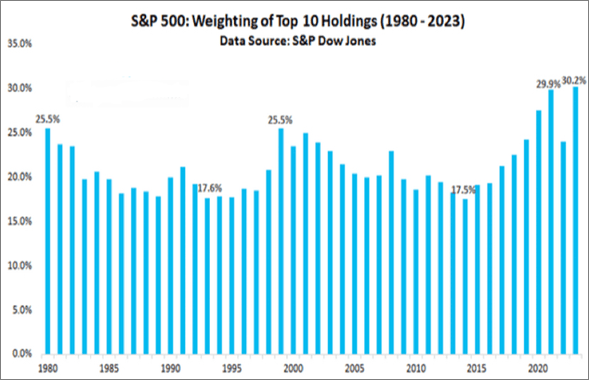
Against the backdrop of a market environment that has seen a rapid increase in interest rates to combat inflation, the conventional expectation was that growth-focused technology businesses would be adversely impacted by continual rate increases. In actuality, the strong financial performance of the Magnificent Seven within the tech sector has lifted equities markets; this is particularly important as they are the leading firms within the top 10 holdings of the S&P 500 Index- which now accounts for approximately 30% of the index’s market capitalization.
Active managers & Investor sentiment
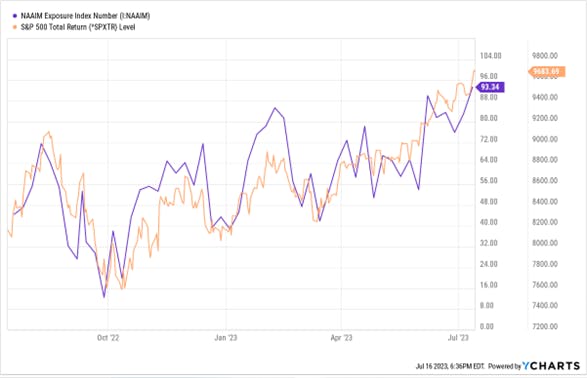
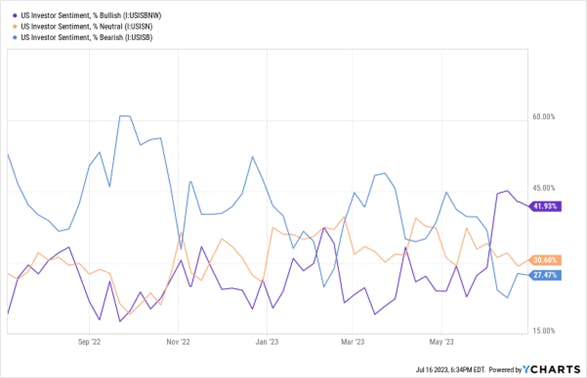
The strong performance of US equities has also resulted in a change in both outlook and asset allocation among active portfolio managers. In looking at the National Association of Active Investment Managers Index, which represents the average exposure to US Equity markets by active portfolio managers, equity exposure has jumped above 90%; this is the highest exposure since November 2021. The AAII Sentiment Survey also shows that 41% of investors surveyed had a bullish outlook that stock prices will rise over the next six months. This high degree of optimism is a marked change from the bearish sentiment that existed among investors for the preceding months.
A brief look at other asset classes
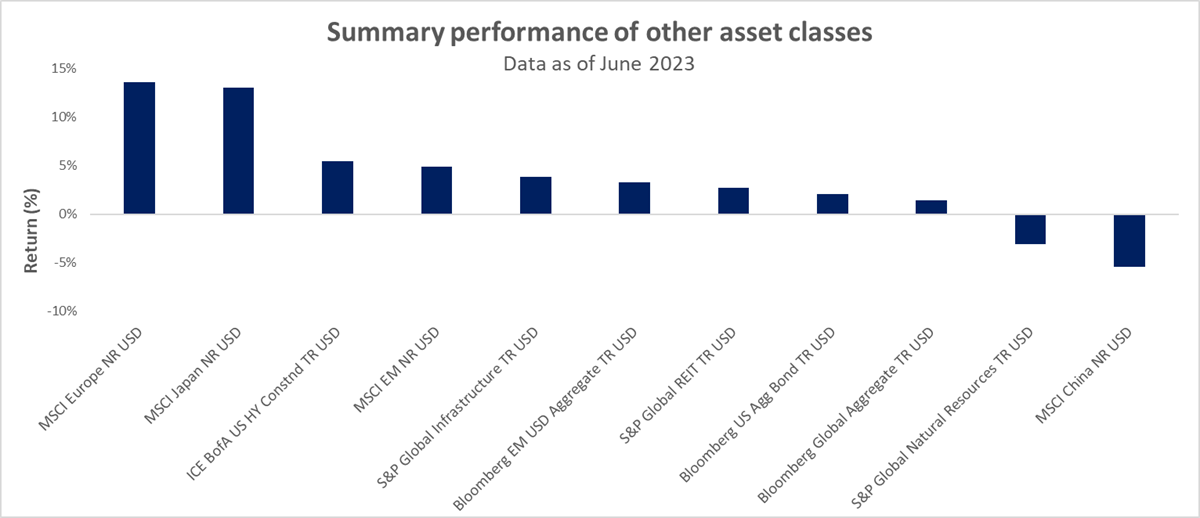
Though the resurgence of US equities has taken the headline space for many investors, other markets have exhibited strong performance in the year thus far. From an equity standpoint, the performance of the European and Japanese markets has been strong, whereas Chinese equities have disappointed, especially given the enthusiasm that was present about their economic re-opening. Among the fixed income asset class, the performance of US high-yield debt truly stands out in comparison to its asset class peers. Finally, the performance of global infrastructure and global REITs has been modest for the year.
Mid-year review: Takeaways
While the strong performance of the US equities market is welcomed, it is clear that said performance is being driven by a select few businesses – but that does not mean that investors cannot participate in the good times that are occurring. Because no one knows what will occur in the second half of 2023, consider dollar-cost averaging into an S&P 500 Index ETF on a monthly or quarterly basis, eliminating the need to waste time on trying to predict when the market will turn.
Additionally, though other equity markets and asset classes may not be doing as well as US equities, it is worthwhile to understand how their inclusion/exposure could fit within one’s portfolio, increasing diversification and minimizing the impact of adverse market events that are yet to be known.
This content was originally published by our partners at ETF Central.
