Gold and silver hit fresh record prices on rate-cut hopes, geopolitics
What if I told you that today’s tech bubble is more hazardous than the one that popped in 2000? You might say, “That’s crazy. Facebook (NASDAQ:FB), Amazon (NASDAQ:AMZN), Apple (NASDAQ:AAPL), Netflix (NASDAQ:NFLX), Google (NASDAQ:GOOG) — today’s internet-oriented superstars are real companies with real profits.”
Granted, all of these corporations are profitable. They may be rapid growers as well. That does not mean investors are paying reasonable or rational prices for their fractional stakes.
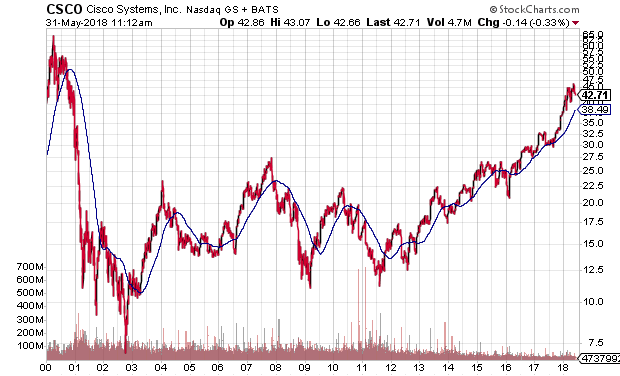
Microsoft (NASDAQ:MSFT), Cisco Systems Inc (NASDAQ:CSCO) and Dell Technologies Inc (NYSE:DVMT) represented roughly 50% of the market capitalization of the NASDAQ 100 in 2000. They too earned boatloads at the turn of the century. That did not stop them from losing three-fourth or more of their value in the 2000-2002 tech wreck. (Note: Cisco is still 35% below a nominal all-time high from 18 years ago.)
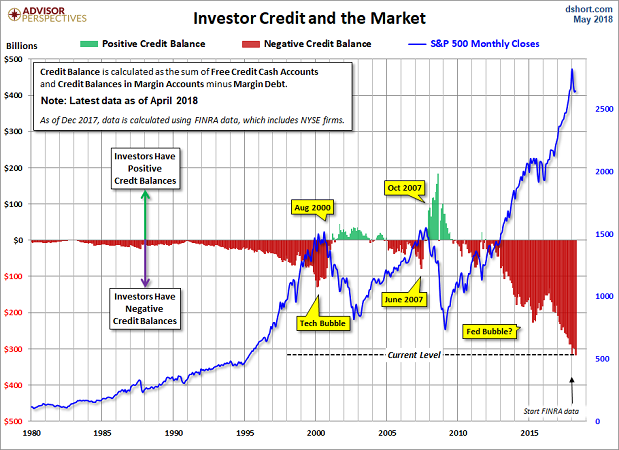
Today, the ‘FAANG 5’ account for a large percentage of the S&P 500 as well as nearly 40% of the NASDAQ 100 (Facebook 5.5%, Amazon 10%, Apple 12%, Google 9%, Netflix 2%). Meanwhile, the foolishness associated with gaining even more FAANG exposure in portfolios can be seen in everything from margin debt excess to closed-end fund premiums.
Speaking of closed-end funds (CEFs), I recently came across a tweet regarding Nuveen’s NASDAQ 100 Dynamic Overwrite Fund (NASDAQ:QQQX). It is trading at a 15.7% premium to net asset value. What does this CEF do to command such a premium? It sells covered calls. That’s it.
Now, you do not have to be a brain surgeon to write covered calls. So the 15.7% premium coupled with the 0.9% management fee borders on the absurd. And yet, QQQX boasts $830 million in assets under management. Indeed, you can literally see the moment when this silliness jumped the Arthur Fonzarelli shark.
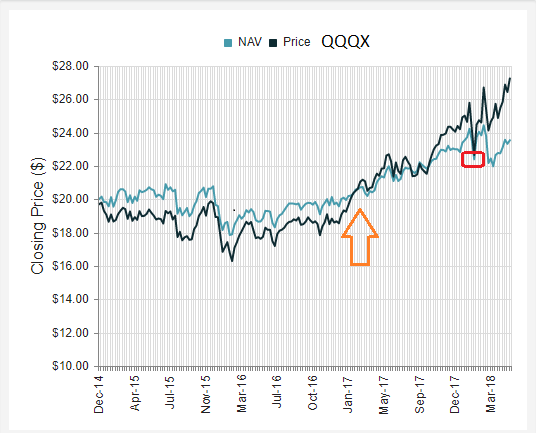
QQQX regularly traded at a discount to net asset value. Then came the November 2016 election and the prospect for sharp tax cuts for corporations. QQQX has since traded at a premium, with the exception of the January 2018 blow-up in the “short volatility trade.”
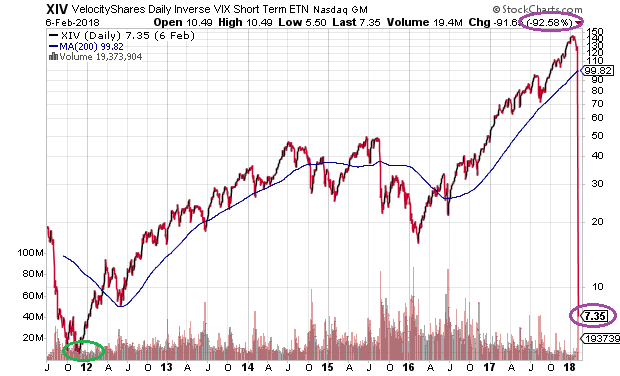
Keep in mind, QQQX holders are not merely long an exorbitantly overpriced NASDAQ 100 at a double-digit percentage premium. They are simultaneously shorting FAANG volatility to generate income. Did they miss what happened to short volatility plays this past January?
“Come on, Gary,” you say. “Today is nothing like 2000’s dot-com disaster. Back then, people were betting on Pets.com, eToys, theGlobe, Buy.com and Webvan.”
Yes, the stock market eventually woke up to the insane valuations for those dot-com IPOs. The subsequent punishment was swift and severe. Nevertheless, were they truly less viable than billion-dollar unicorns like WeWork, Buzzfeed, Pinterest, Credit Karma or Bird?
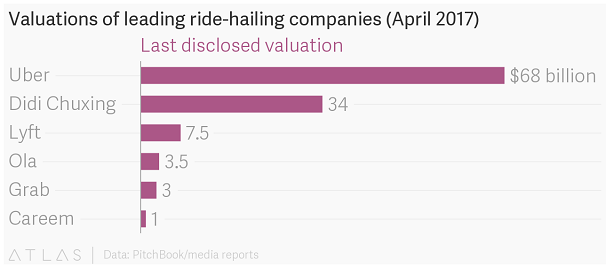
Consider a company that most people love, Uber. It has plans to “go IPO” in 2019. Yet it lost nearly $3 billion in 2016 and has lost $4.5 billion in 2017. Not only does it lose tons of cash, but there are halfway decent competitors. It may be a phenomenal company with the goal of becoming the “Amazon of transportation,” but the valuation of $68 billion is exactly the type of IPO silliness that occurred in 2000.
In truth, another tech wreck is more likely than not. The only question is the catalyst.
Nobody has ever irrefutably identified the catalyst or catalysts for the the March of 2000 stock meltdown. Still, there is some agreement on the notion of Federal Reserve policy error. In particular, Fed tightening activity encouraged the 10-year’s 200-basis point rise between the Asian Currency Crisis lows of 1998 and the first quarter of 2000.
In a similar vein, the Fed tightening cycle that occurred between 2004-2006 led to a 10-year yield that rose 200 basis points off of the 2003 lows. Marginal subprime borrowing became more and more of a challenge at those higher rates, eventually spreading like a cancer throughout the global financial system and ushering in the 2008 catastrophe.
It follows that central bank manipulation may be the catalyst for a bearish turn this time around. Like 1998-2000 and 2004-2006, we are participating in a Fed tightening cycle where the Fed’s quantitative tightening (QT) may contribute to the 10-year reaching 200 basis points above its lows. (Note: We witnessed 1.36% on the 10-year yield back in July of 2016.)
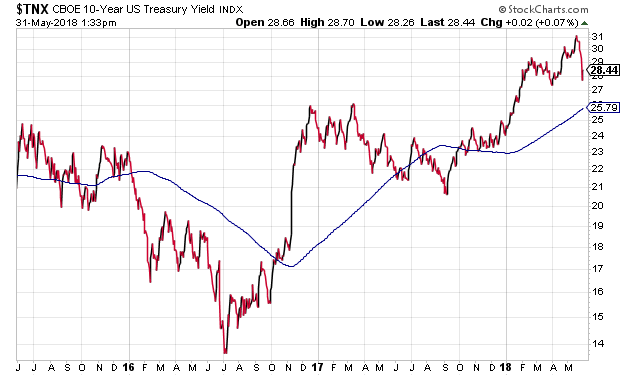
The 3.11% level is still 25 basis points shy of a true 200-basis point move. That said, the Fed’s current approach – a combination of raising its overnight lending rate and the reduction of bonds on its balance sheet – increases the cost of capital. And when the cost of capital rises, less credit-worthy borrowers will be in a world of hurt.
Remember, 50% of S&P 500 corporations are rated BBB. That’s just one notch higher than junk-rated debt. Even in a mild period of contraction for the economy, many of those would be downgraded to junk, forcing investment-grade bond funds to sell them. Other bondholders will want to liquidate as well.
When everyone wants to sell and few are looking to buy, what happens to price? What happens to liquidity, or the likelihood that the bid-ask spread will widen to unbelievable extremes? People who own a junk bond priced at 88 and who hope to sell it near that price could discover that 76 is the best that they’re going to get.
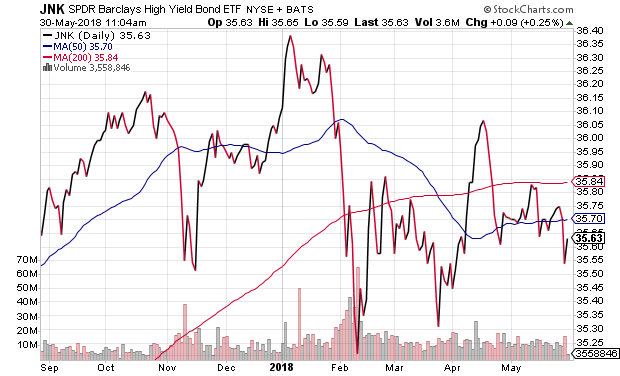
Junk bonds themselves may already be sending up a smoke signal. The 50-day moving average of the SPDR Barcklays High Yield Bond ETF (NYSE:JNK) crossed below its 200-day moving average in March. Moreover the current price is below both the 50-day and 200-day trendline.
Ironically enough, if there is enough debt contagion in the euro-zone, the Fed might slow its pace of quantitative tightening (QT). And if that occurs, lower rates may keep the unicorns as well as the NASDAQ 100 going strong for a while longer.
On the flip side, there are far too many companies worth a fraction of their $1 billion-plus valuations. Those who blindly pay any price for a tech-filled future — cloud-based computing, electric vehicles, artificial intelligence, robotics, sharing economy, crypto, etc. — are gambling with their financial well-being.
Riding a wave can be exhilarating. Just make sure to have a plan for getting off of the wave.
Disclosure Statement: ETF Expert is a web log (“blog”) that makes the world of ETFs easier to understand. Gary Gordon, MS, CFP is the president of Pacific Park Financial, Inc., a Registered Investment Adviser with the SEC. Gary Gordon, Pacific Park Financial, Inc., and/or its clients may hold positions in the ETFs, mutual funds, and/or any investment asset mentioned above. The commentary does not constitute individualized investment advice. The opinions offered herein are not personalized recommendations to buy, sell or hold securities. At times, issuers of exchange-traded products compensate Pacific Park Financial, Inc. or its subsidiaries for advertising at the ETF Expert website. ETF Expert content is created independently of any advertising relationship.
