It will be a hectic week for stocks with a lot of economic data and the start of the earnings season. All of the big banks will give us an update on their businesses and, more importantly, a sense of the general trends in the economy. Additionally, we get two key inflation data points this week, from PPI and CPI.
S&P 500 (SPY)
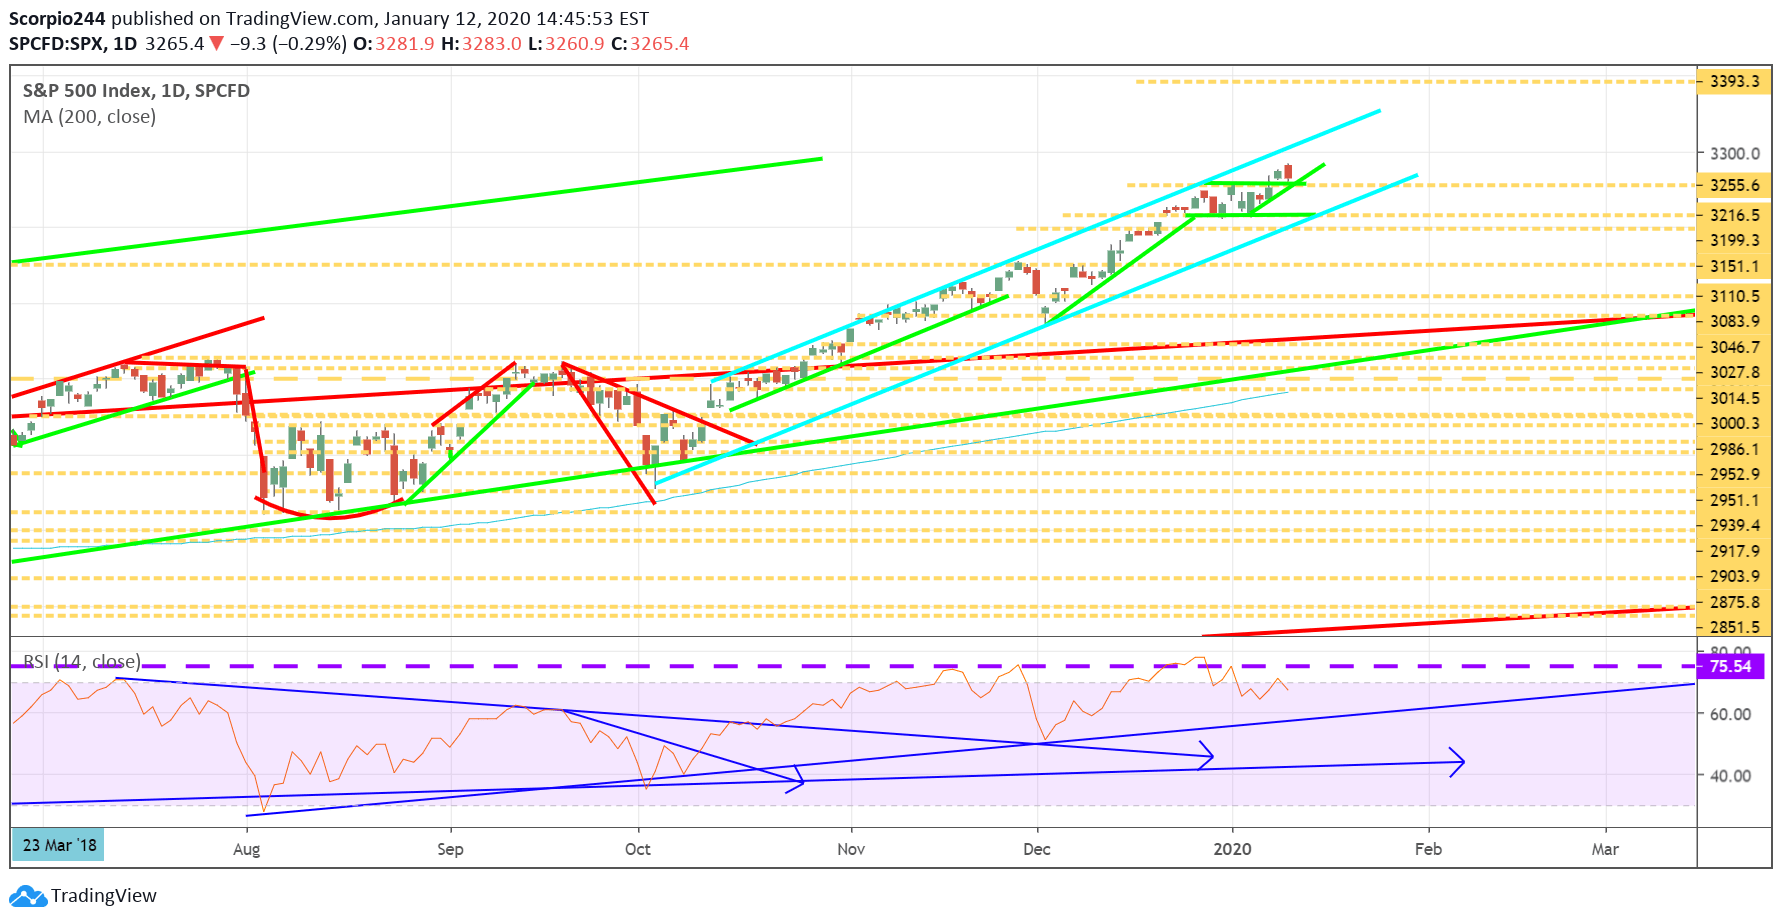
The S&P 500 will enter the week trading just a touch off its all-time highs around 3,265. Not much has changed for the index, and based on the technicals; the trend remains higher. The index appears to have just broken free of a bullish pattern known as a Flag, and it would suggest the index continues to trend higher. For now, the next short-term level of resistance would come around 3,320.
JPMorgan (JPM)
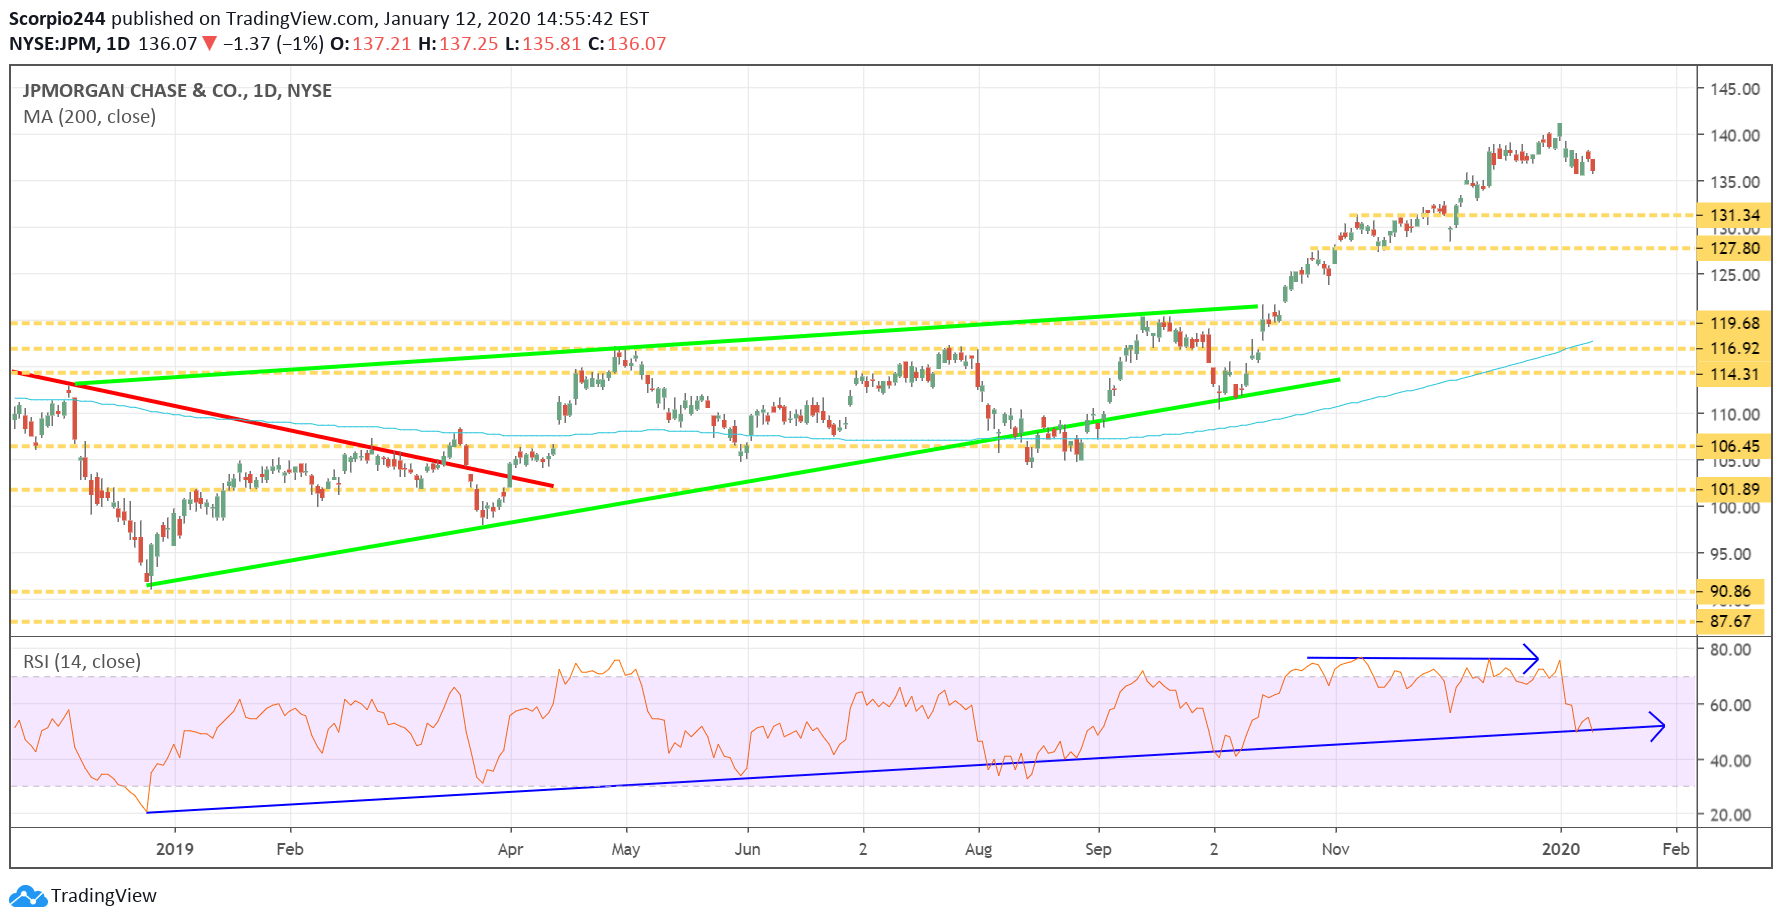
JPMorgan (NYSE:JPM) will reports results on Tuesday, and whether or not the company reports good results, I think the shares may be heading lower in the day and weeks ahead. The stock has had a tremendous move higher in recent weeks, and the RSI is now declining. Nothing dramatic, but a decline to $131 seems reasonable.
Bank of America (BAC)
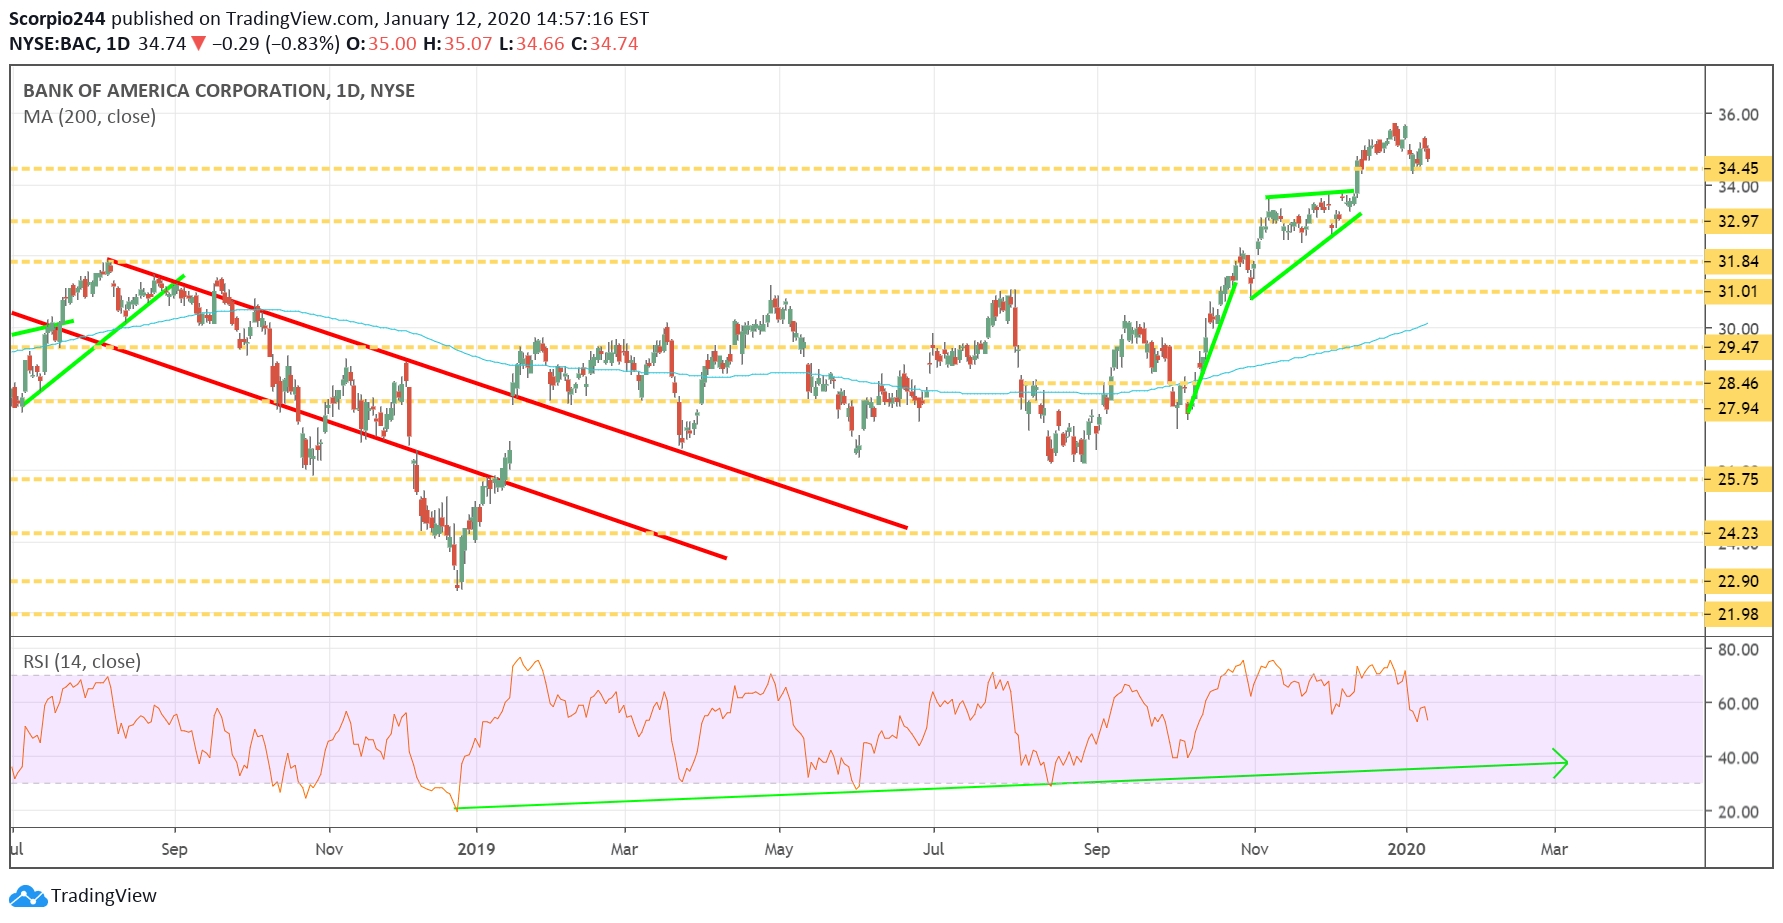
Bank of America (NYSE:BAC)’s RSI is also changing trend, and the stock is sitting on support around $34.50. A decline to $33 seems possible.
Roku (ROKU)
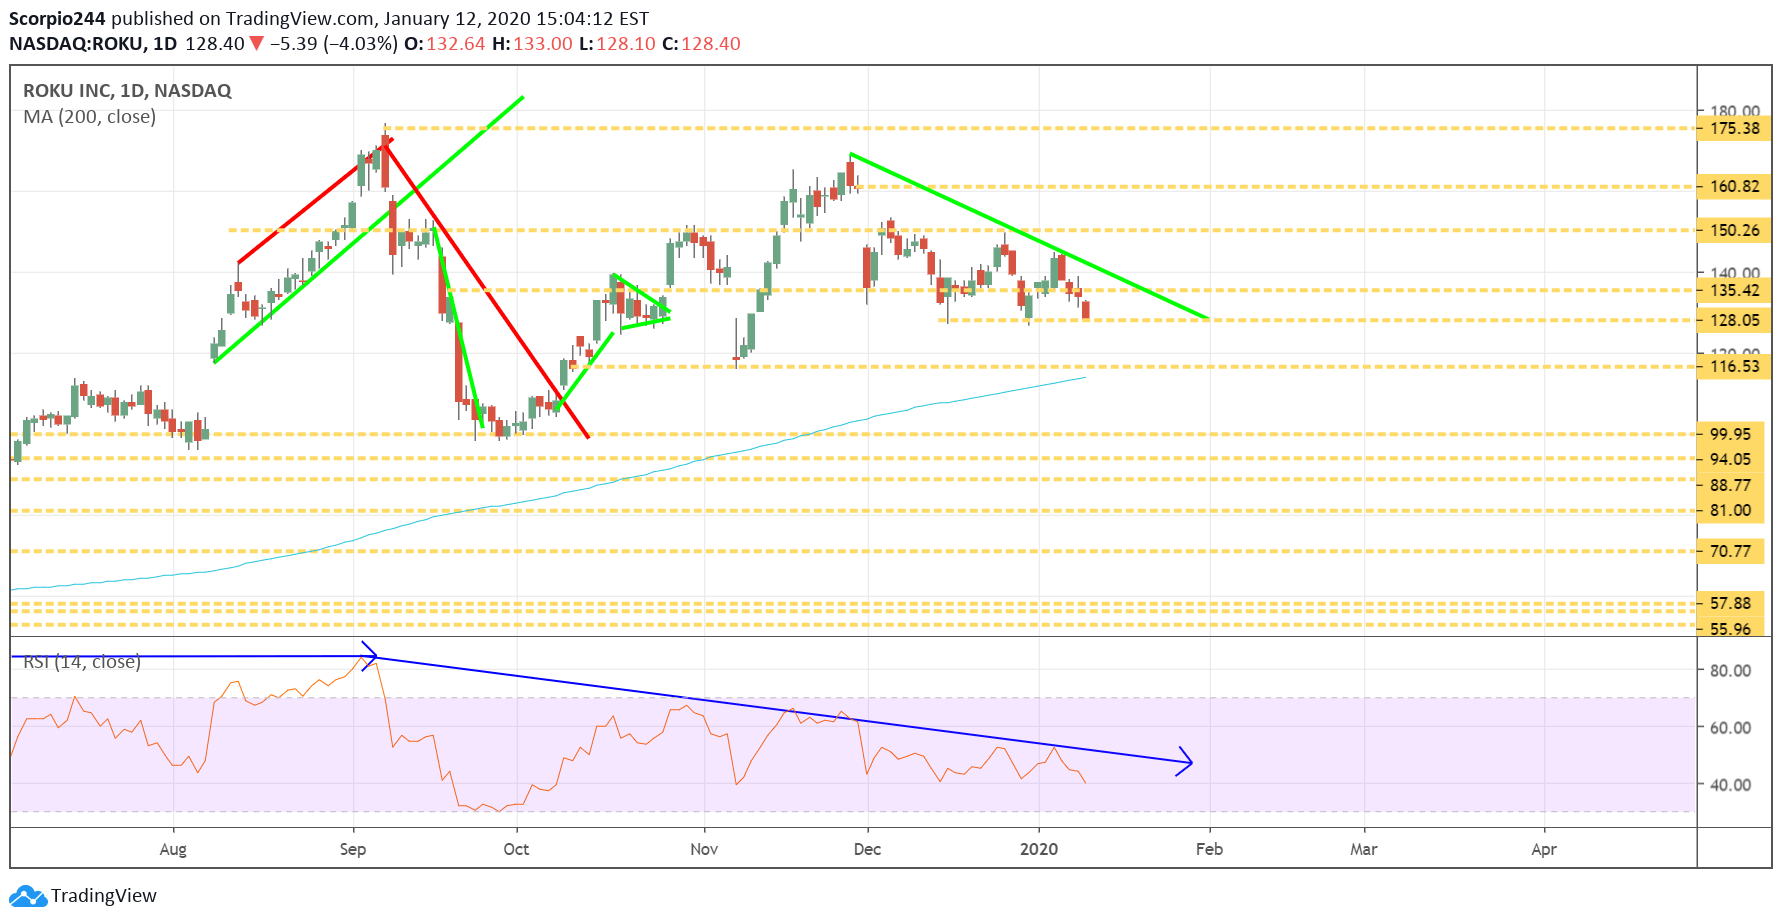
Did you see the news out of CES that Amazon Fire has more subs than Roku? It has 40 million to Roku’s 32 million. Perhaps that means that Amazon (NASDAQ:AMZN) should trade at 7.2 times one-year forward sales? Maybe, it sounds good, it would make Amazon the most valuable company in the world, with a market cap of $2.8 trillion, from today’s $933 billion. Sounds ridiculous, right? That’s because it is, and so is Roku trading at that multiple. Anyway, the chart for Roku is weak and is likely to continue to trend lower to around $116 this week. That is a nearly perfect descending triangle.
Amazon (AMZN)
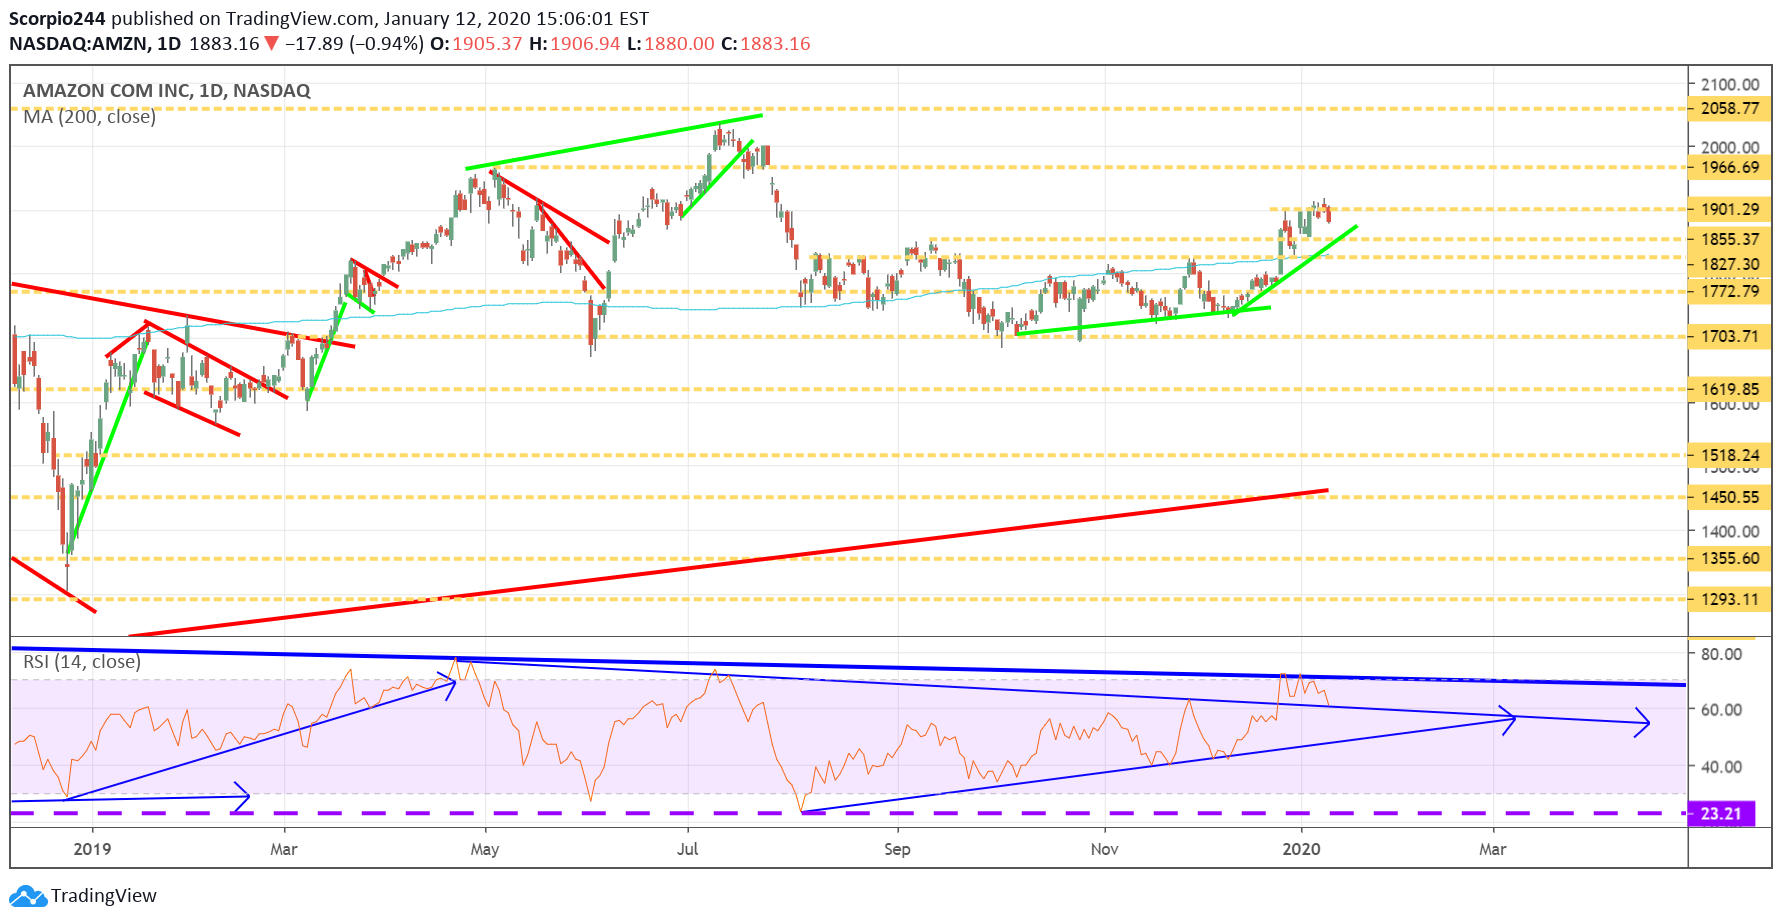
Speaking of Amazon (NASDAQ:AMZN), the stock has been trending higher, but I think it first needs to fall back to $1,855, before resuming higher to $1,960.
PayPal (PYPL)
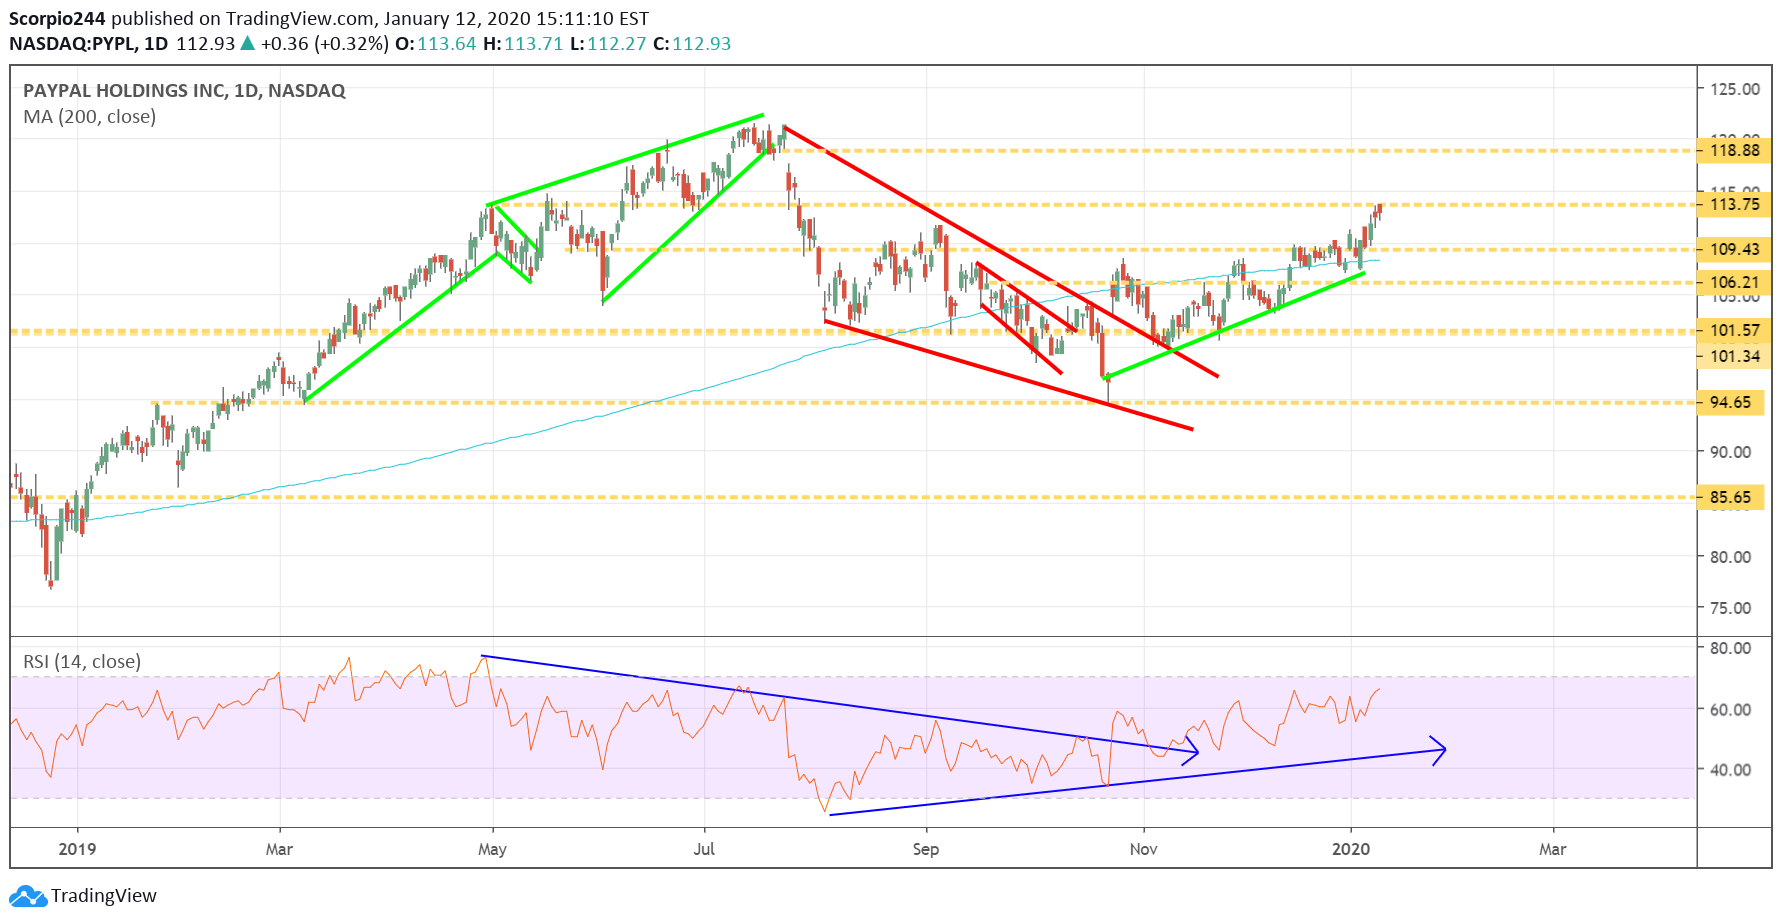
PayPal (NASDAQ:PYPL) is at a resistance level of around $113.75, and it could be heading higher toward $119.
Intel (INTC)
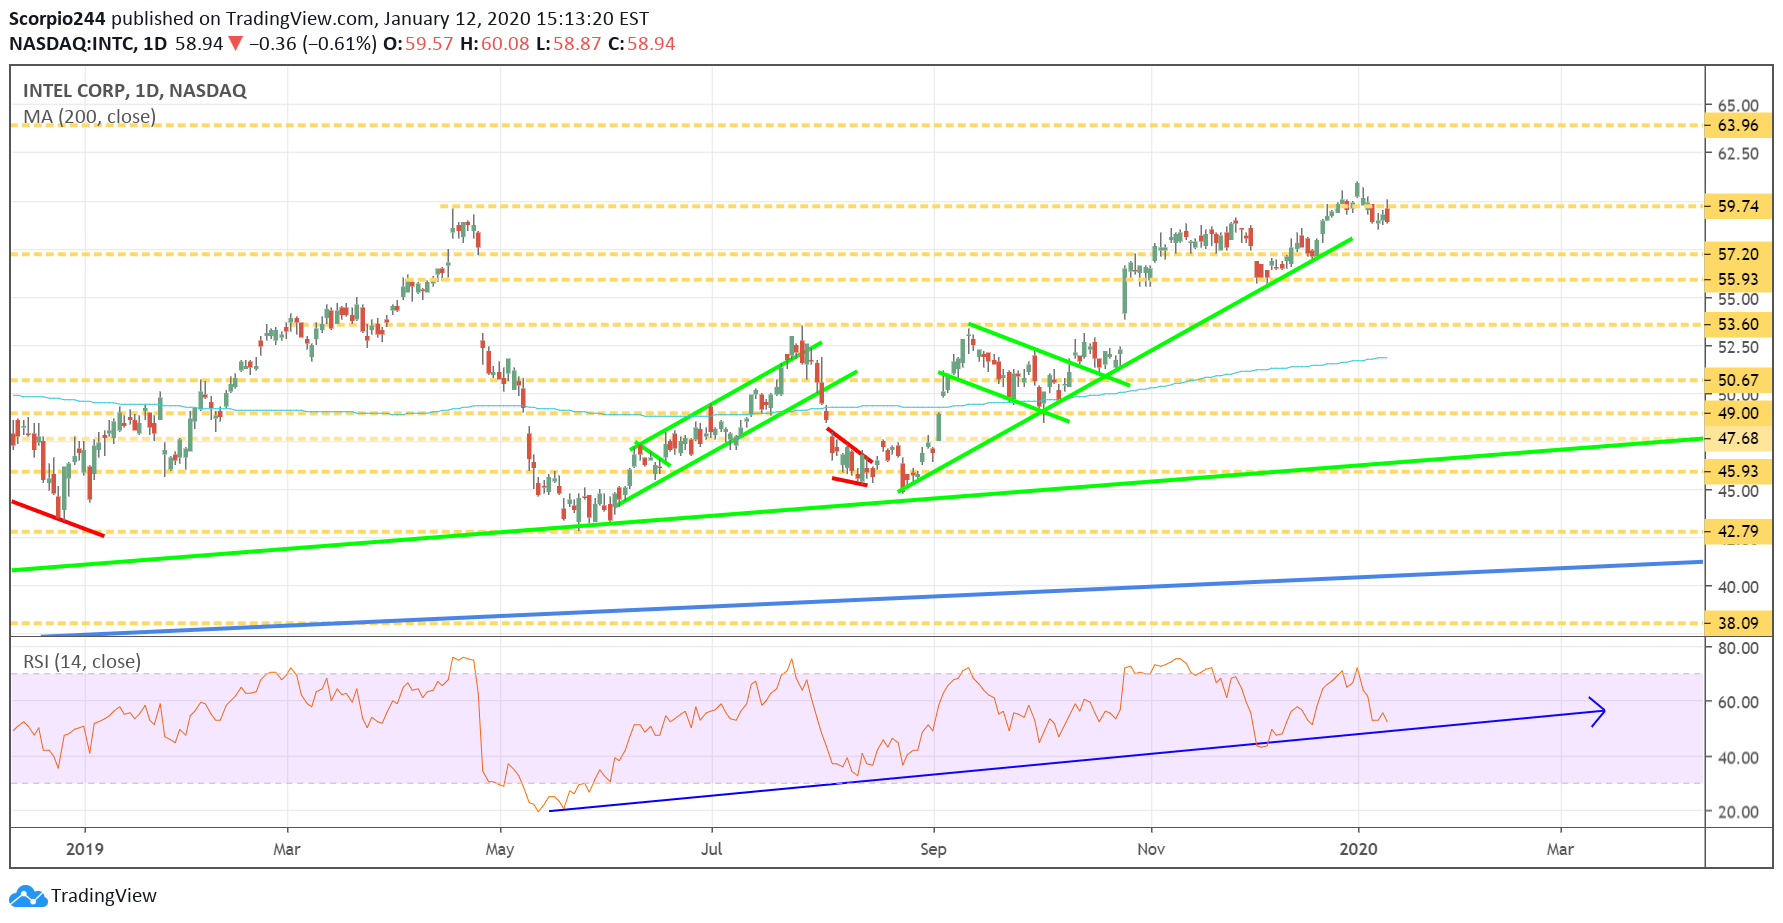
I saw some bullish option betting in Intel (NASDAQ:INTC) over the past few days, and that indicates, along with the chart, that the stock may rise to around $64.
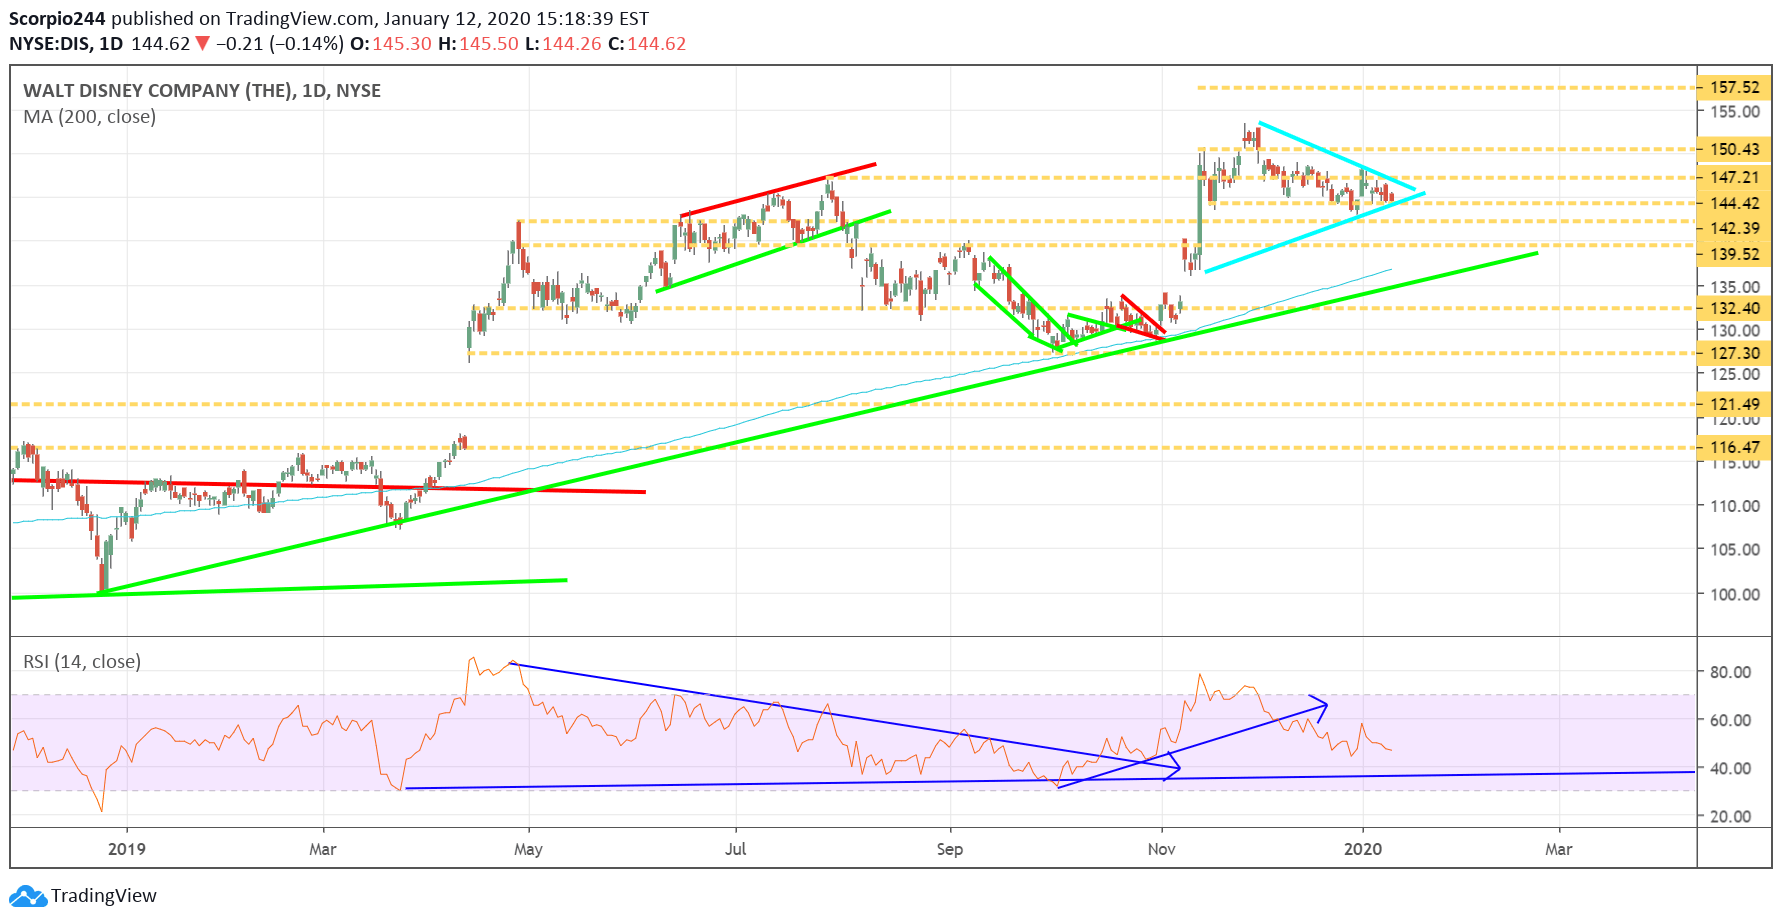
Disney (DIS)
Disney (NYSE:DIS) appears to be forming a symmetrical triangle, and that would indicate to me the potential for the shares to jump to around $158.
Blackberry (BB)
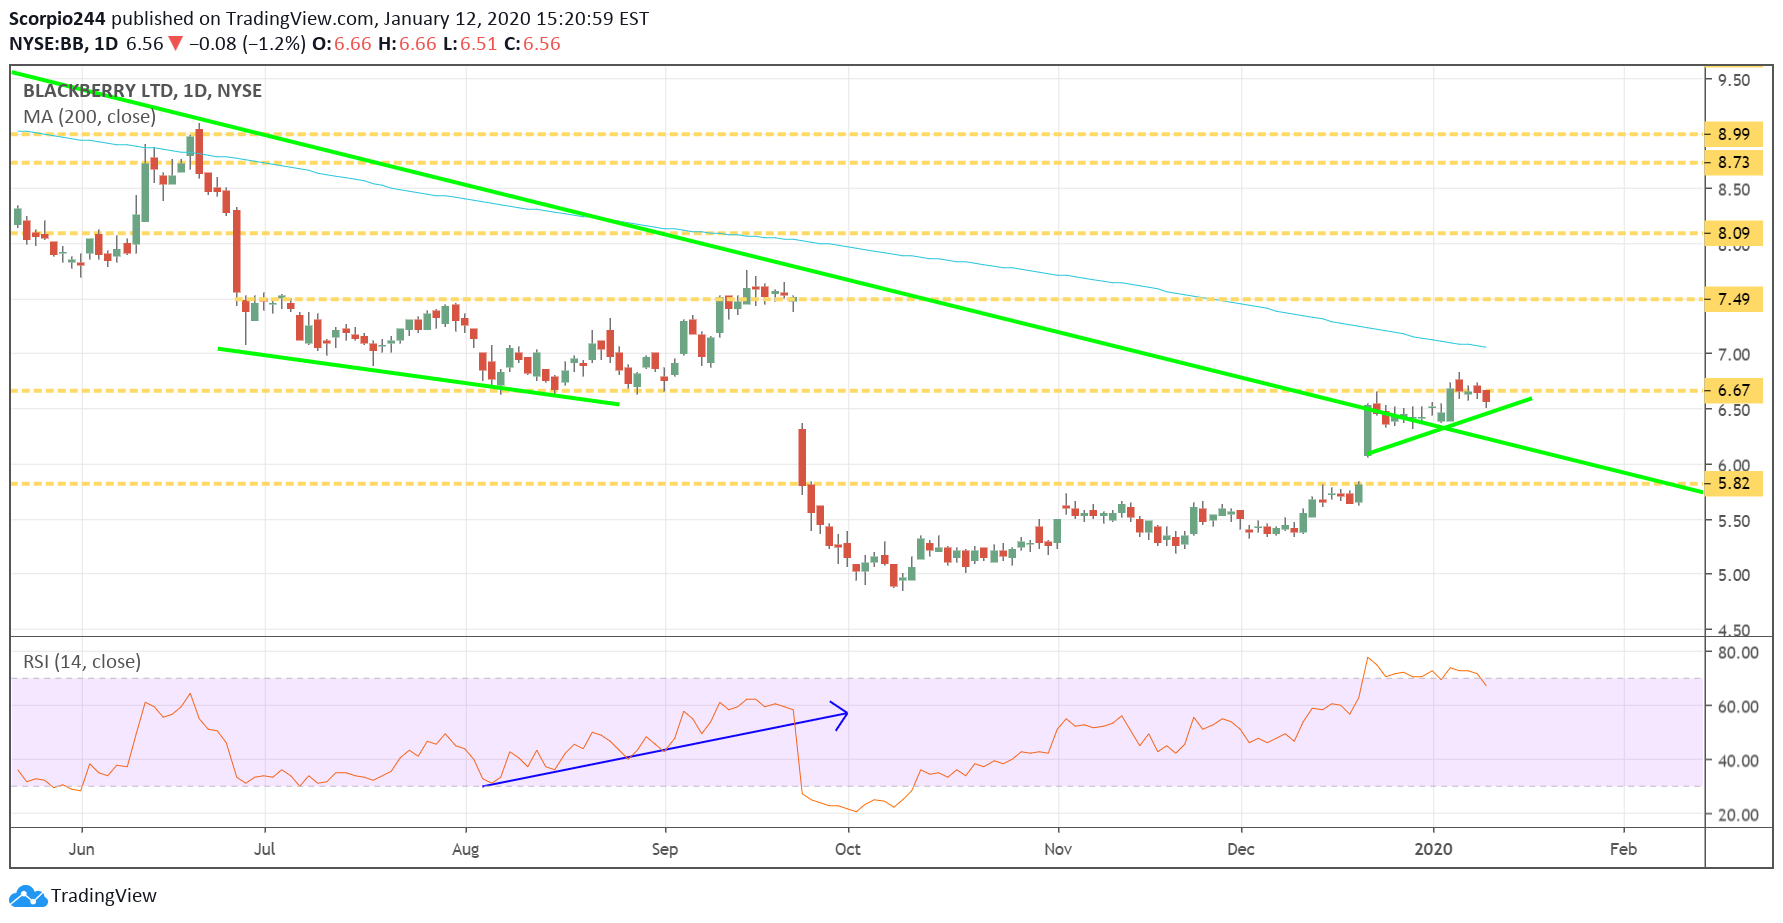
Blackberry (TSX:BB) may be forming a rising triangle of its own on its way to a gap fill at $7.50.
