This week will be much more volatile, if nothing more, but for the fact that options expiration was last week.
The week following the major OPEX of the month always seems to carry more volatility, and that is because the options positioning in the market declines, so sharply, it provides, in a sense, less gravity for prices to center around. Considering the amount of open interest the options market generates compared to the past, the volatility in these “modern times” seems much higher.
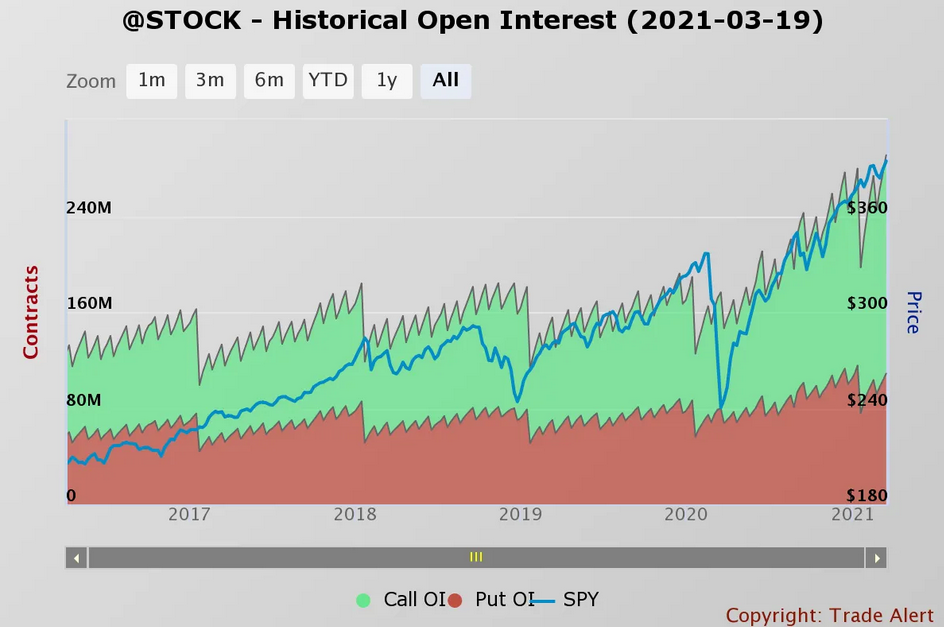
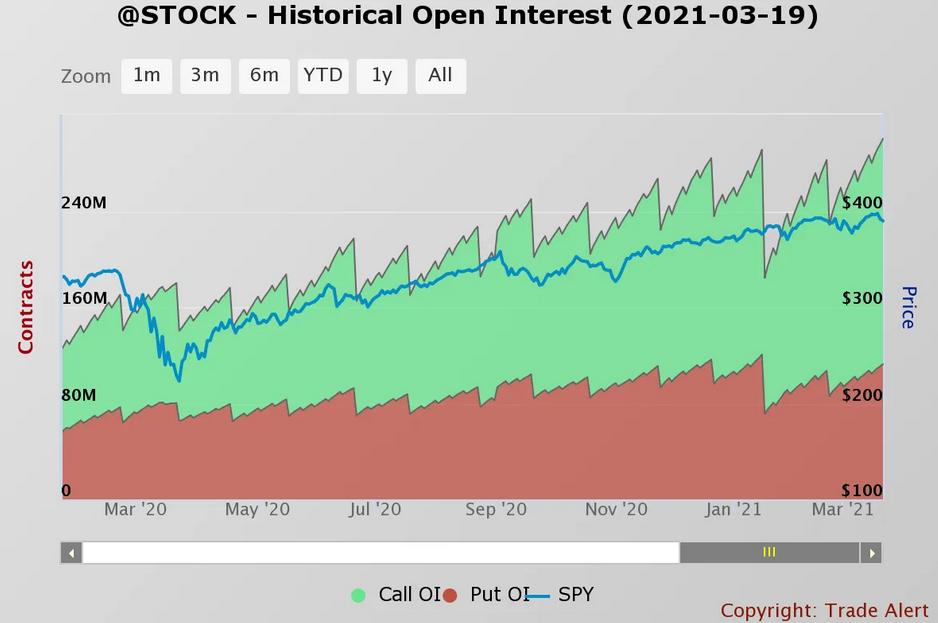
You can almost see the peaks and troughs in the S&P 500 when lined up against the open interest dips. Is it perfect? No, but it may be perfect enough that a drawdown this week should not come as a surprise until open interest levels start building again.
1. S&P 500 (SPY)
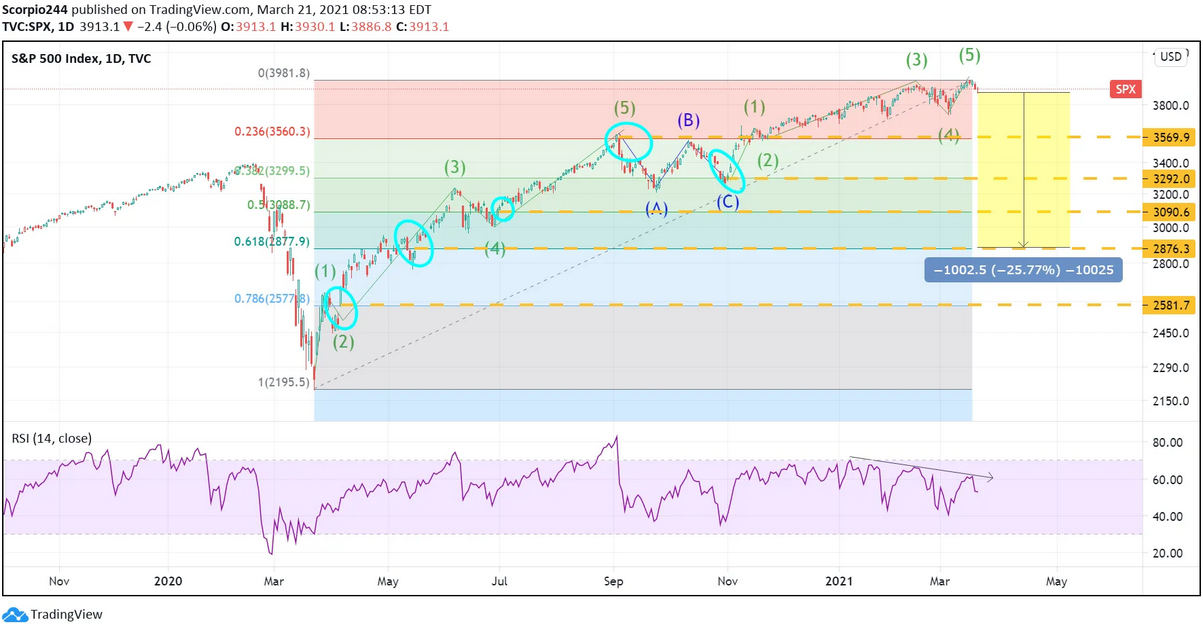
This does, after all, make this region in the S&P 500 (NYSE:SPY) the perfect candidate for a peak in the index. The chart below is stunning; potentially having completed another 5 wave count, the Fibonacci retracement levels of the Mar. 23, 2020 lows to Mar. 17, 2021 peak are jaw-dropping.
All major retracement levels line-up with a significant level of support or a major gap in the index. The 23.5% level of retracement lines up perfectly with 3,560, the 38.2% level lines-up with a gap at 3,290, the 50% level with 3,090, the 61.8% level at 2,870, and the 78.6% level with 2,570. On a linear chart…
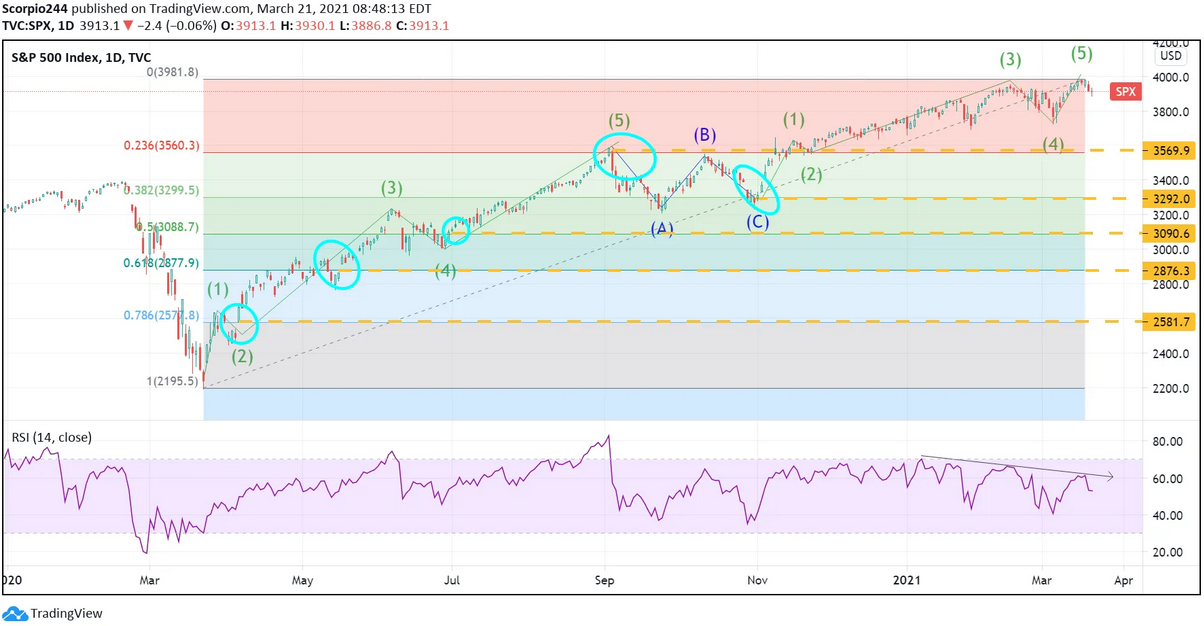
…and a log chart.
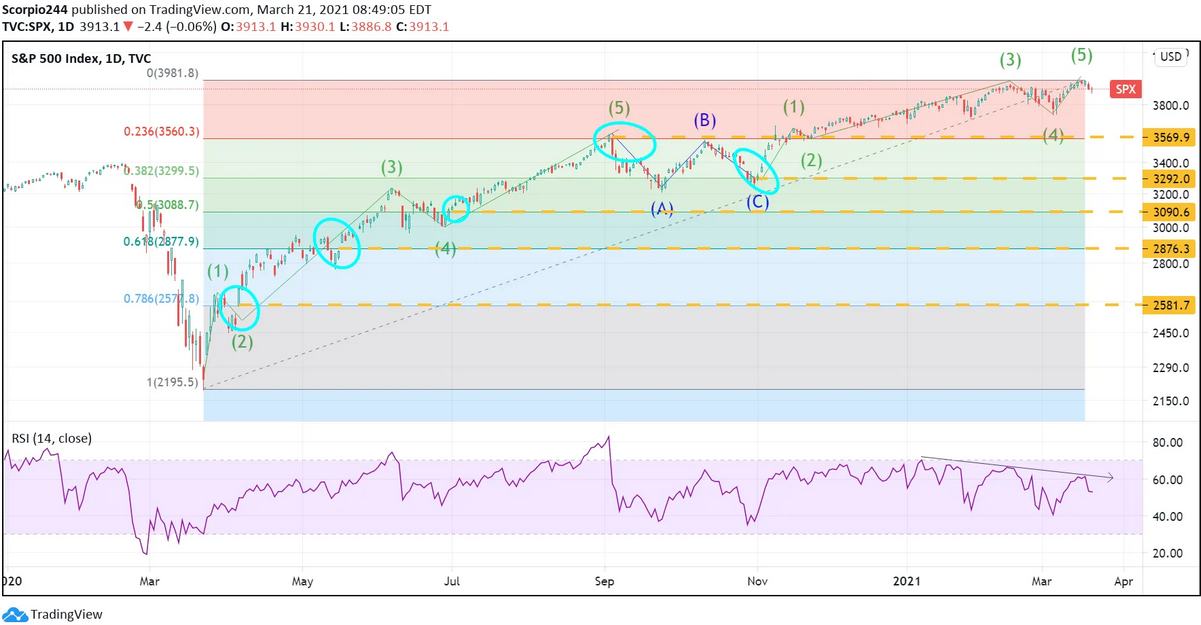
If you are a believer in Fibonacci and the Elliot-wave cycle, it makes the S&P 500 current set-up a powerful candidate for a pullback to the 23.5% or 38.2% level of retracement, and dare I say a 62.8% pullback.
A drop to 3,570 would amount to a 9% drop from current levels, a drop to 3,290 would amount to a decline of an additional 15.7%, and a drop to 2,870 would be a drop of 26%.
2. NASDAQ (QQQ)
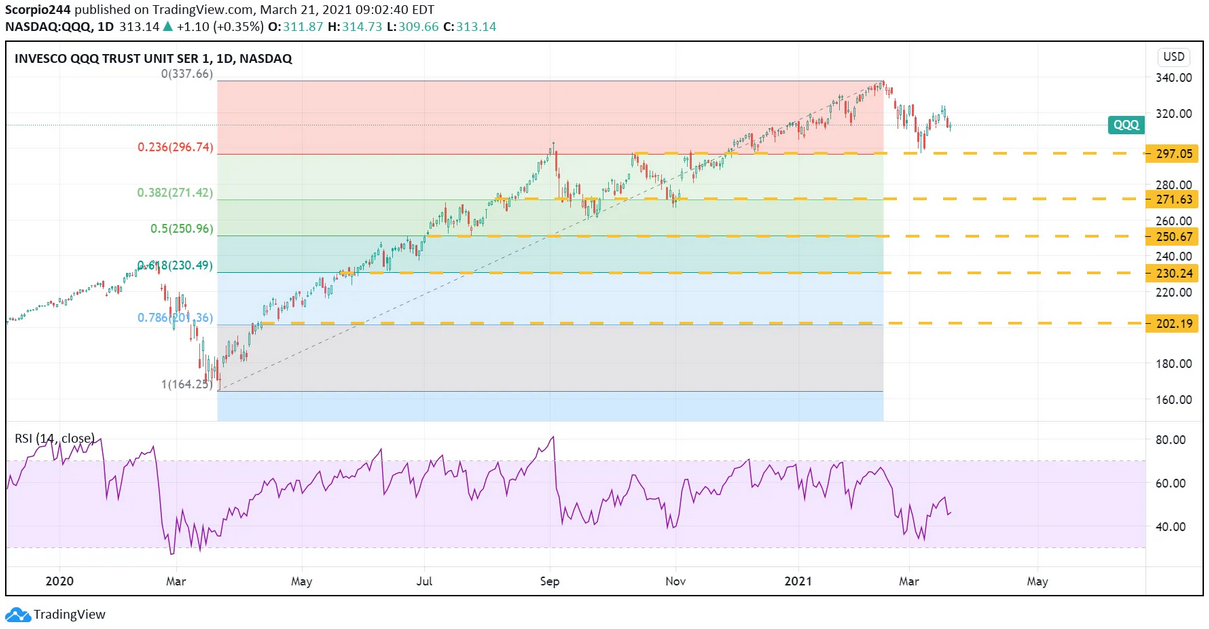
It is probably not by chance; a similar pattern exists in the NASDAQ Invesco QQQ Trust (NASDAQ:QQQ) ETF, with the ETF already falling to and testing the 23.6% retracement level around $297.
3. VIX
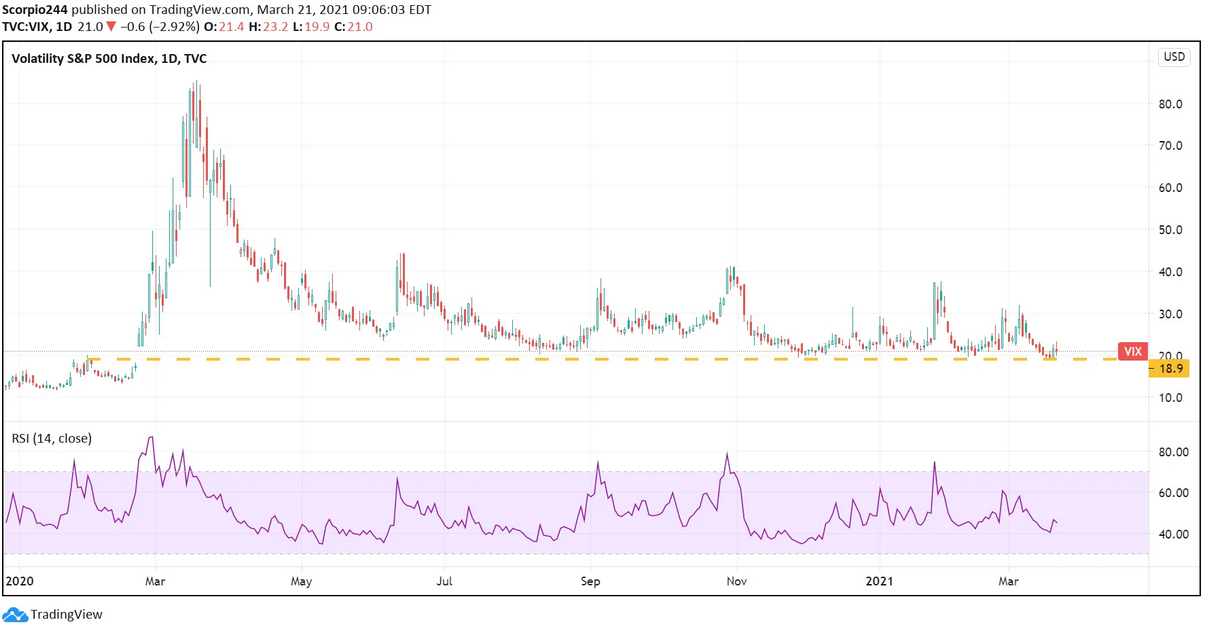
Couple that with a VIX that is at the low end of the range, and Intraday may have filled the gap created from February of 2020. This helps to make this current setup in the market an interesting point in history.
4. Amazon
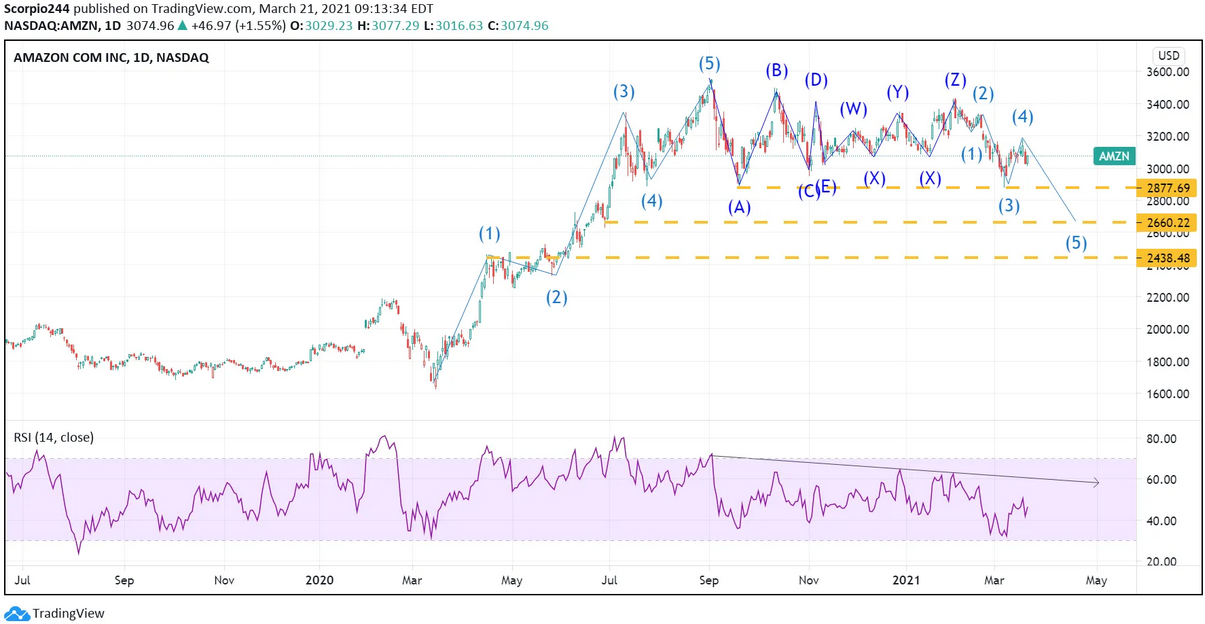
Overall the trend in Amazon (NASDAQ:AMZN) is still lower as determined by the relative strength index and could result in the stock declining to around 2,660 in the weeks ahead.
5. Deere
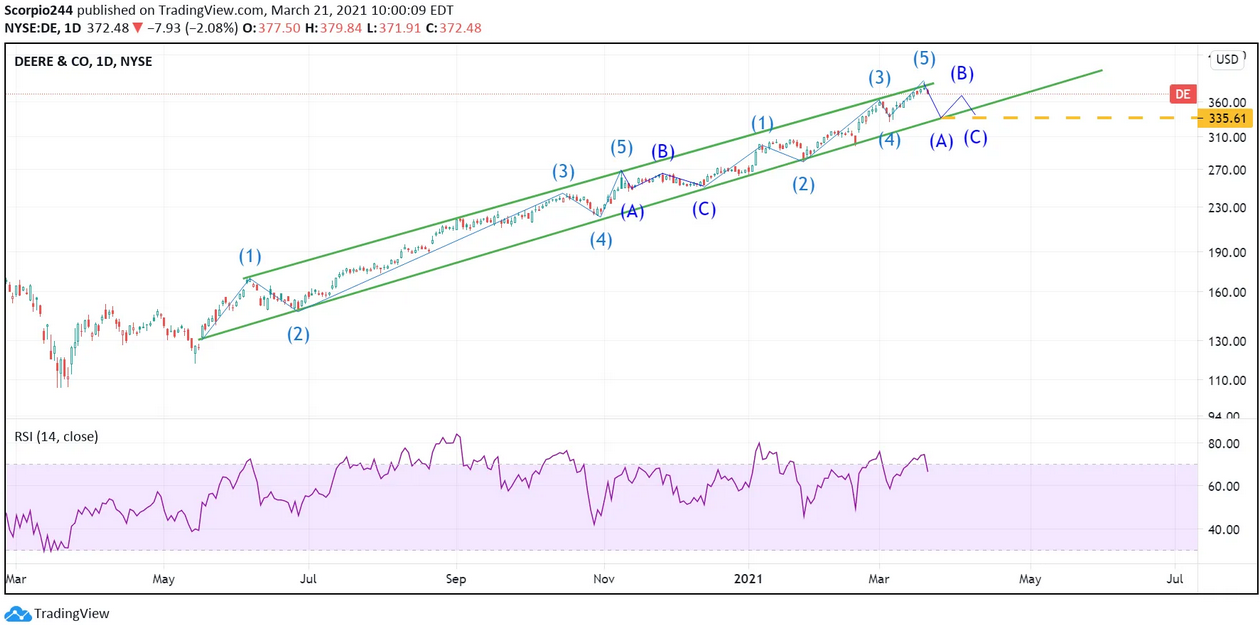
Deere & Company's (NYSE:DE) log chart reveals how nicely the channel has been in the stock and how that channel is now in jeopardy, with the potential for a retracement to the lower end of the channel at $335.
6. Roku
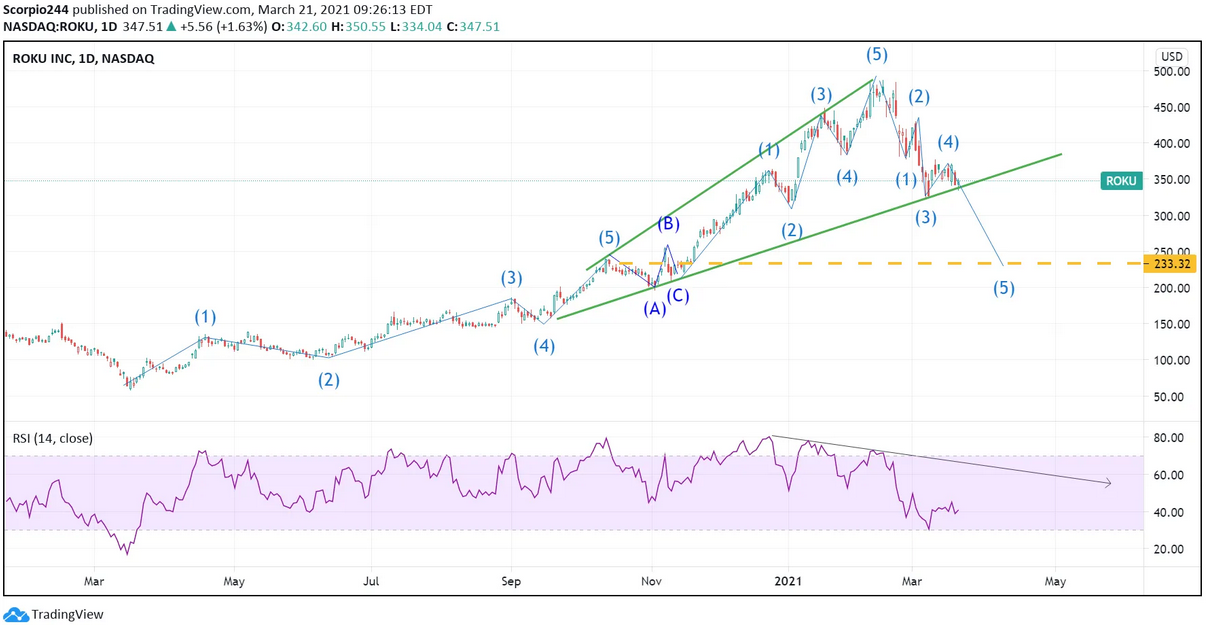
Roku (NASDAQ:ROKU) continues to move further into content, now with the acquisition of “This Old House.” It proves that you need to be more than just Switzerland, and maybe their ad-only model isn’t the end all be all. The stock is now at an inflection point. A break in the uptrend probably sends this thing spiraling back to $225.
7. AMD
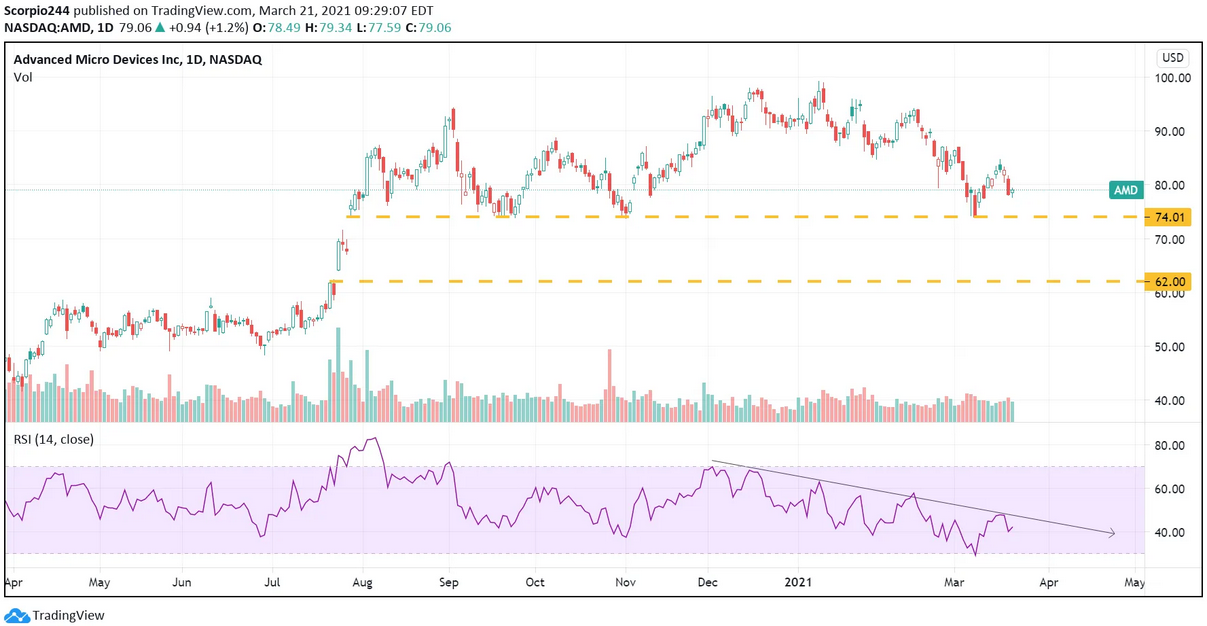
Advanced Micro Devices (NASDAQ:AMD) has held support at $74 on several occasions, and as I have said for months, this Xilinix deal is the worst thing that could have happened to current shareholders and is why this stock has done nothing for months. Again, there is a difference between good deals for companies and good deals for the stock. This is a deal that is good for the company, not the stock.
8. Freeport
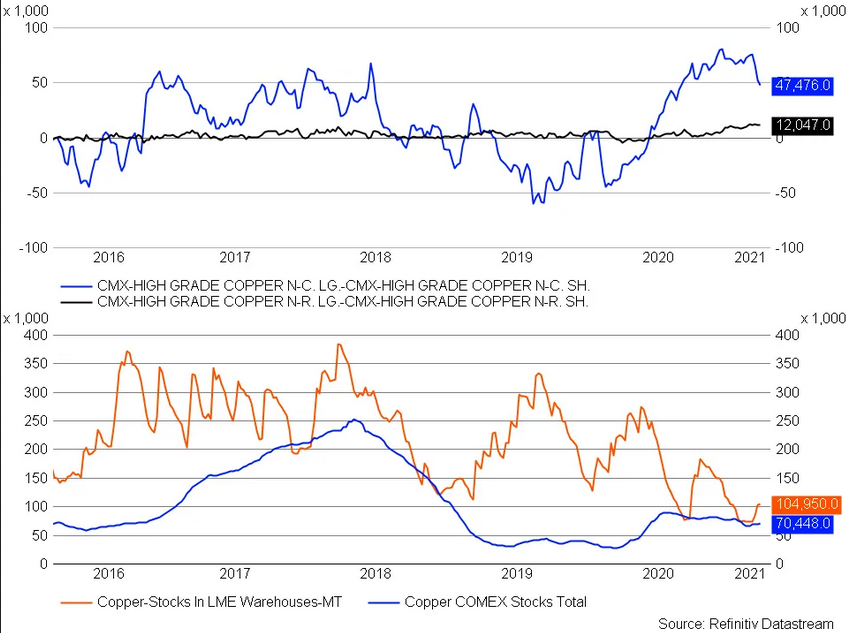
Is this end of the line for Freeport-McMoran Copper & Gold (NYSE:FCX)? It could be. The RSI suggests it is. We will find out a lot if it breaks below $31.50.
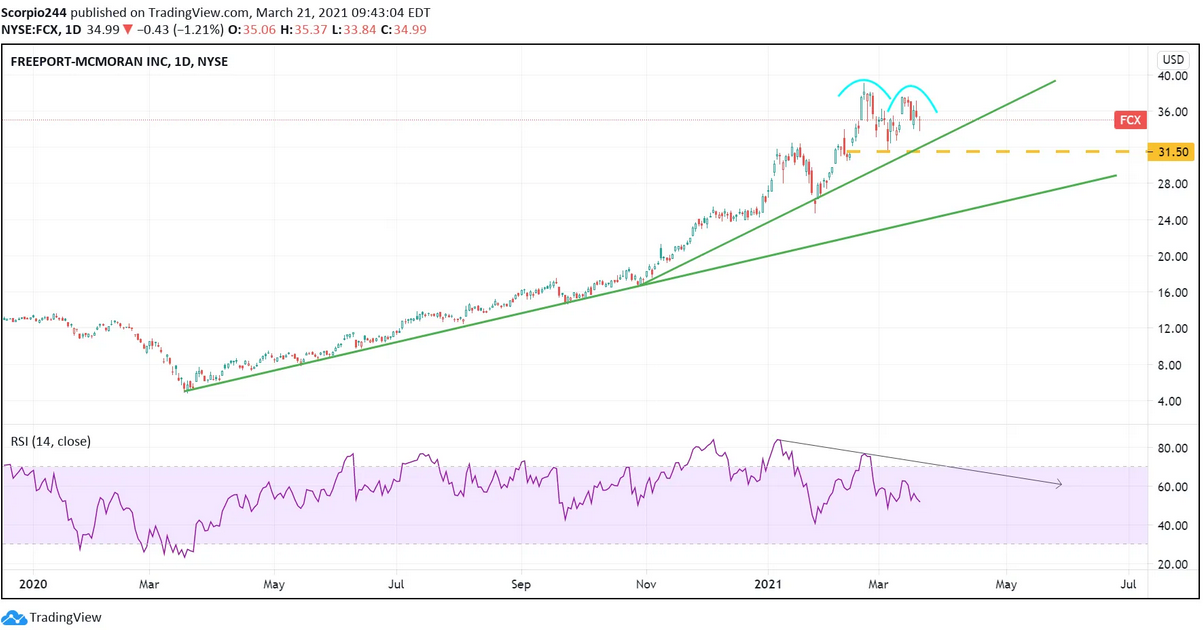
Those speculators in copper are closing out their long futures positions pretty quickly. Better watch out.
Buckle up, this week might get rocky.
