Summary- Oil prices are increasing.
- Despite a lack of inflationary or wage pressure, the Fed continues to raise rates, increasing the possibility of a yield curve inversion.
- The 4-week moving average of initial unemployment claims is still very positive.
At the end of last year, I wrote an article titled "Five Key Charts for 2018" which discussed inflation, oil prices, wages, initial unemployment claims, and the yield curve. The purpose of the article was to isolate specific economic data that would have the most impact on the economy, policy-makers, and investors in 2018. Now that we're three months into the year, it seems appropriate to revisit this column to see the status of these five charts.
Let's start with oil prices by explaining why this is an important economic statistic. As I explained in the previous article:
Professor James Hamilton has noted that oil price spikes are one of the primary causes of most post-WW II recessions. This expansion in oil prices have been very tame, largely thanks to OPEC opening the production spigot in 2014 to drive U.S. frackers out of the market (which only happened temporarily).
To that, I would add an observation from San Francisco Fed President John Williams (who will soon move to the New York Fed) that economic shocks - such as sudden price spikes in key commodities - cause recessions. And with the Middle East tensions heating up, oil prices could spike.
Let's begin with the daily chart:
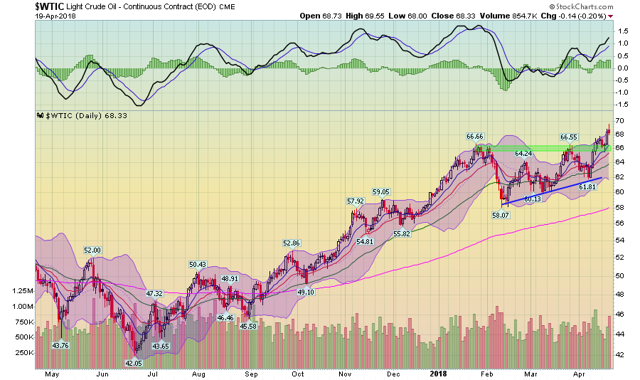
Prices recently consolidated in an upward wedge pattern. Prices moved through top-side resistance and are now near a 52-week high. The moving averages are in a bullish pattern - all are rising and the shorter are above the longer. Momentum is rising. This chart says very clearly that prices are likely to move higher.
Let's next look at the weekly chart:
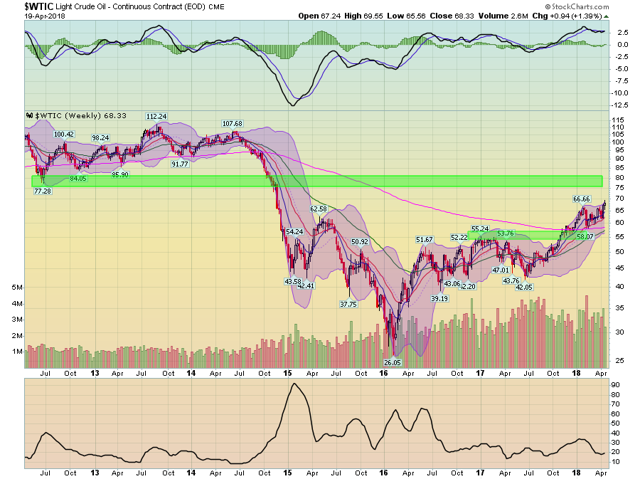
This chart is very similar to the daily chart. Prices are bullishly aligned and the EMAs are rising. There are two key limiting factors, however. Momentum is moving lower, and there is upside resistance in the upper 70s. Both of these factors could limit upside growth.
The conclusion is the oil prices have rallied 27% since the beginning of the year. They were at very low levels, so the move higher isn't concerning yet. But if we have another quarter like this one, oil could become a factor as it would begin to slow consumer spending.
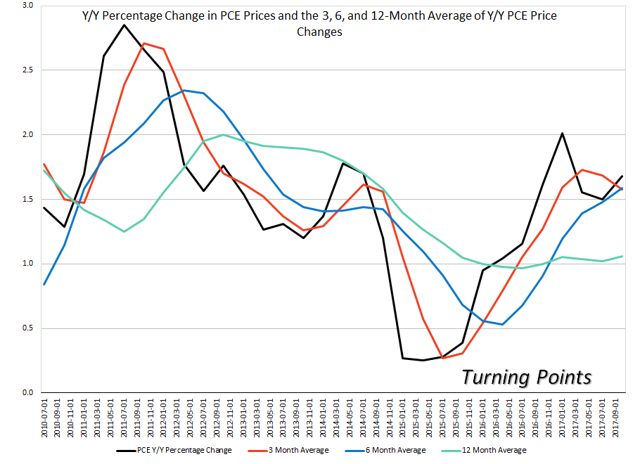
Next, let's look at Fed policy beginning with a look at inflation, or, more specifically, PCE price pressures. The Fed prefers this price measure because it has a far broader reach: CPIs only measure a basket of goods while PCE deflators cover durables, non-durables, and service prices. Here's a chart of the Y/Y percentage change in PCE prices:
I've also included the 3-, 6-, and 12-month moving average. The black line is the monthly Y/Y number; it hit 2% - the Fed's target - earlier this year but has since moved lower. None of the moving averages have come meaningfully close to the Fed's two percent target in over five years.
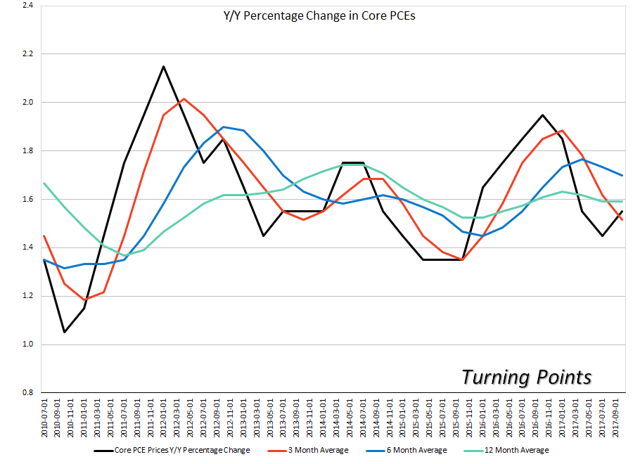
The core PCEs price indexes have a similar pattern:
Core PCE moved above 2% in 2011 and came close to 2% in 2015. But this price measure remains very much below 2%. The moving averages are all below 2% as well and all are currently moving lower.
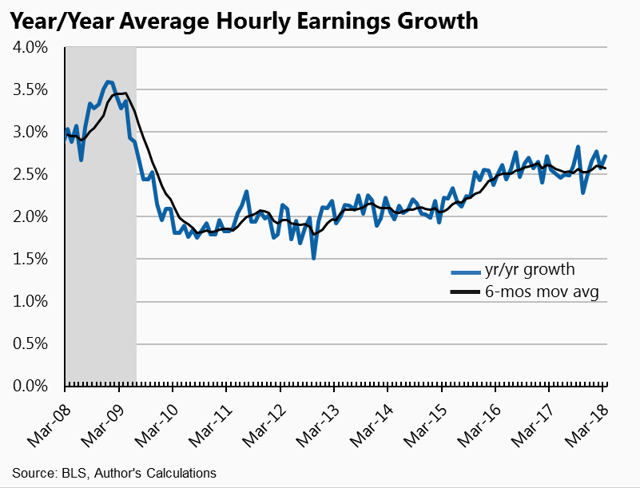
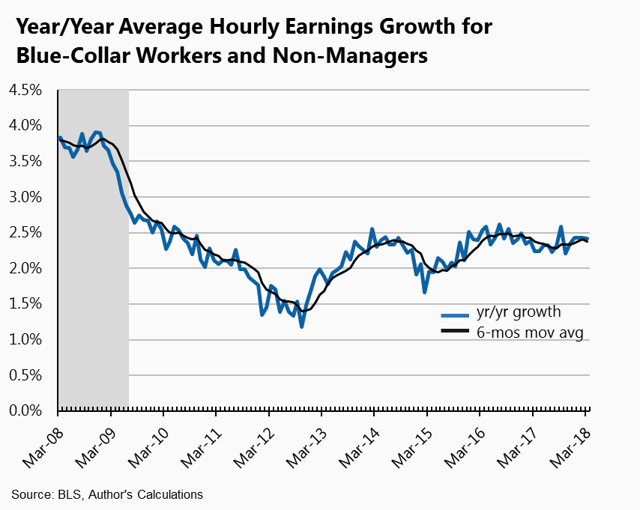
Another indicator of potential inflation is wage growth. For this, I'll defer to two charts from Jared Bernstein, a top-notch economist:
Both charts show that wage growth is contained. This is another reason why PCE price pressures are so weak.
What this means is that inflation remains a non-issue. Despite this, the Fed is clearly in a rate-hiking mood, which is collapsing the yield curve:
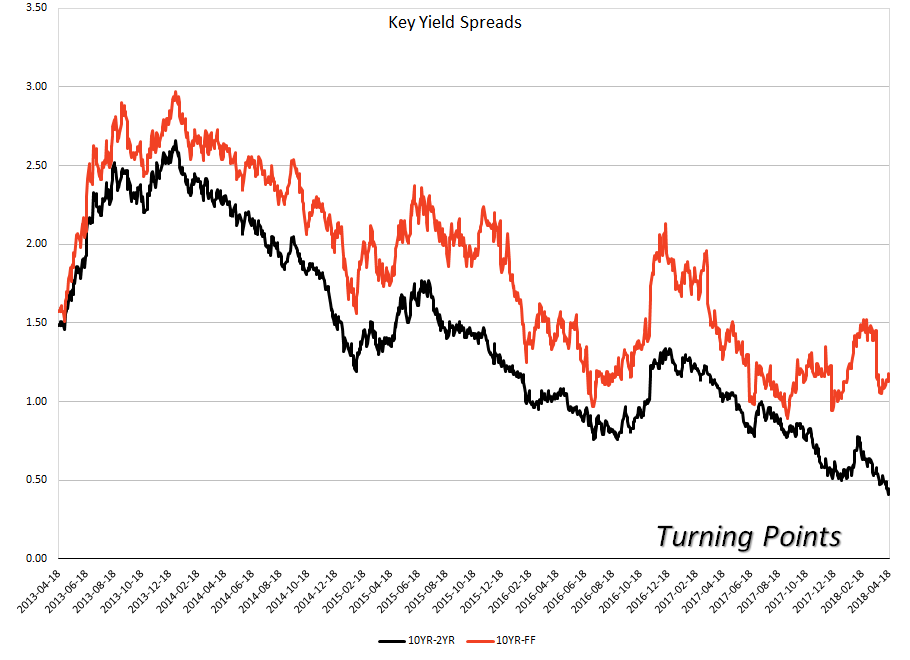
The 10-2 spread (in black) is now below 50 basis points. This is due to a large increase in the 2-year yield, which traders are bidding up in anticipation of further rate hikes. We're also seeing compression in the 10-year Fed Funds rate (in orange), although 100 basis points seem to be a point of key resistance right now. Either way, the yield curve is clearly compressing. As I wrote earlier this week, this makes a yield curve inversion a real possibility.
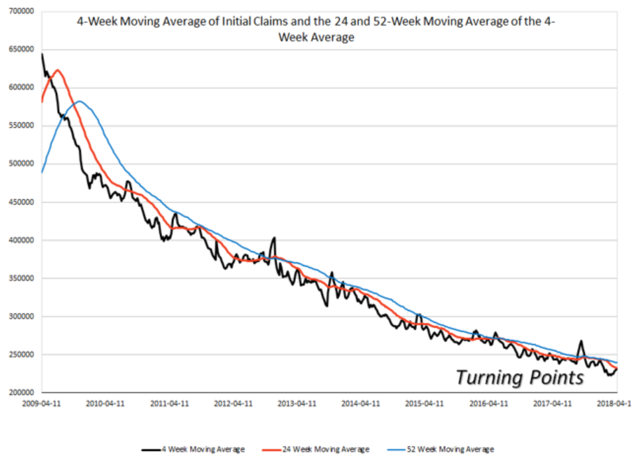
Finally, we have the 4-week moving average of initial unemployment claims:
This metric has a good track record of rising between 6 and 12 months before a recession begins. Right now, they're still trending lower. And the 4-week moving average (in black) is still below the 24- and 52-week moving average, which is also a positive indicator.
So, let's wrap all this up. Oil prices are still low by historical standards, but they are rising. They're not at problem levels yet, but if they keep moving up, they'll start to squeeze consumer spending. Despite a lack of price and wage pressure, the Fed is dead-set on raising interest rates, which is collapsing the yield curve. As St. Louis Fed President Bullard recently noted, there is a more than small possibility we could see the yield curve invert this year (I made the same observation earlier this week). Finally, the 4-week moving average of initial unemployment claims is still declining, which means this key economic number hasn't given us a recession signal yet.
The near flashing yellow is the yield curve situation. Despite any meaningful inflationary pressure, the Fed is in the mood to normalize rates. That means there's a distinct possibility that the Fed over-tightens, inverting the yield curve. And, if history is any guide, a recession will follow.
Disclosure: I/we have no positions in any stocks mentioned, and no plans to initiate any positions within the next 72 hours.
I wrote this article myself, and it expresses my own opinions. I am not receiving compensation for it (other than from Seeking Alpha). I have no business relationship with any company whose stock is mentioned in this article.

