
- Merck & Co. beat Q4 2023 analyst estimates for a loss of 11 cents by 14 cents.
- Seagate Technology beat fiscal Q2 2024 analyst estimates for a loss of 6 cents by 18 cents, marking its first profitable quarter in a year and potential bottom to the prolonged bearish cycle.
- Southwest Airlines (NYSE:LUV) almost tripled Q4 2023 analyst EPS estimates.
Earnings season is well underway, and the winner-and-loser separation continues to grow. Of the companies that beat consensus analyst estimates, even fewer go well beyond and exceed analyst expectations.
Are these one-off events, financial engineering, lowballed forecasts or a sign of an improving trend? Three companies have more than doubled their EPS estimates in the transportation, computer and technology and medical sectors.
Merck & Co. Inc.
Merck & Company Inc (NYSE:MRK), a leading global pharmaceuticals company, develops and manufactures prescription drugs for a diverse range of therapeutic areas, including cardiovascular diseases, neurosciences, oncology, immunology, infectious disease, vaccines and women's and animal health.
Its blockbuster drugs include Keytruda, with Q4 2023 sales growing 22% year-over-year (YoY) to $6.6 billion. Oncology saw Lynparza sales rise 8% YoY to $315 million. Gardasil sales rose 27% YoY to $1.9 billion, with strong global demand in China. Animal health sales rose 4% to $1.3 billion YoY in Q4 2023.
Triple flush
Merck reported Q4 2023 EPS of three cents, beating analyst estimates for a loss of 11 cents by 14 cents. Revenues grew 5.8% to $14,63 billion versus $14.49 billion consensus analyst estimates. Check out the sector heatmap on MarketBeat.
Raising 2024 guidance
Merck raised its full-year 2024 guidance with EPS of $8.44 to $8.59 versus $8.40 consensus analyst estimates. Revenues are expected between $62.7 billion to $64.2 billion versus $63.47 billion analyst estimates.
For the next decade, Merck raised its outlook for oncology revenues to grow over $20 billion, up from $10 billion. Cardiometabolic revenues should grow over $15 billion, up from $10 billion. Immunology should grow into the multi-billion range.
Merck CEO Robert Davis commented, “2023 was another very strong year for Merck. I am extremely pleased by the progress we’ve made to develop and deliver transformative therapies and vaccines that will help save and improve lives around the world. We reached more than 500 million people with our medicines last year alone.”
Look for Merck & Co. analyst ratings and price targets at MarketBeat. Find Merck & Co. peers and competitor stocks with the MarketBeat stock screener.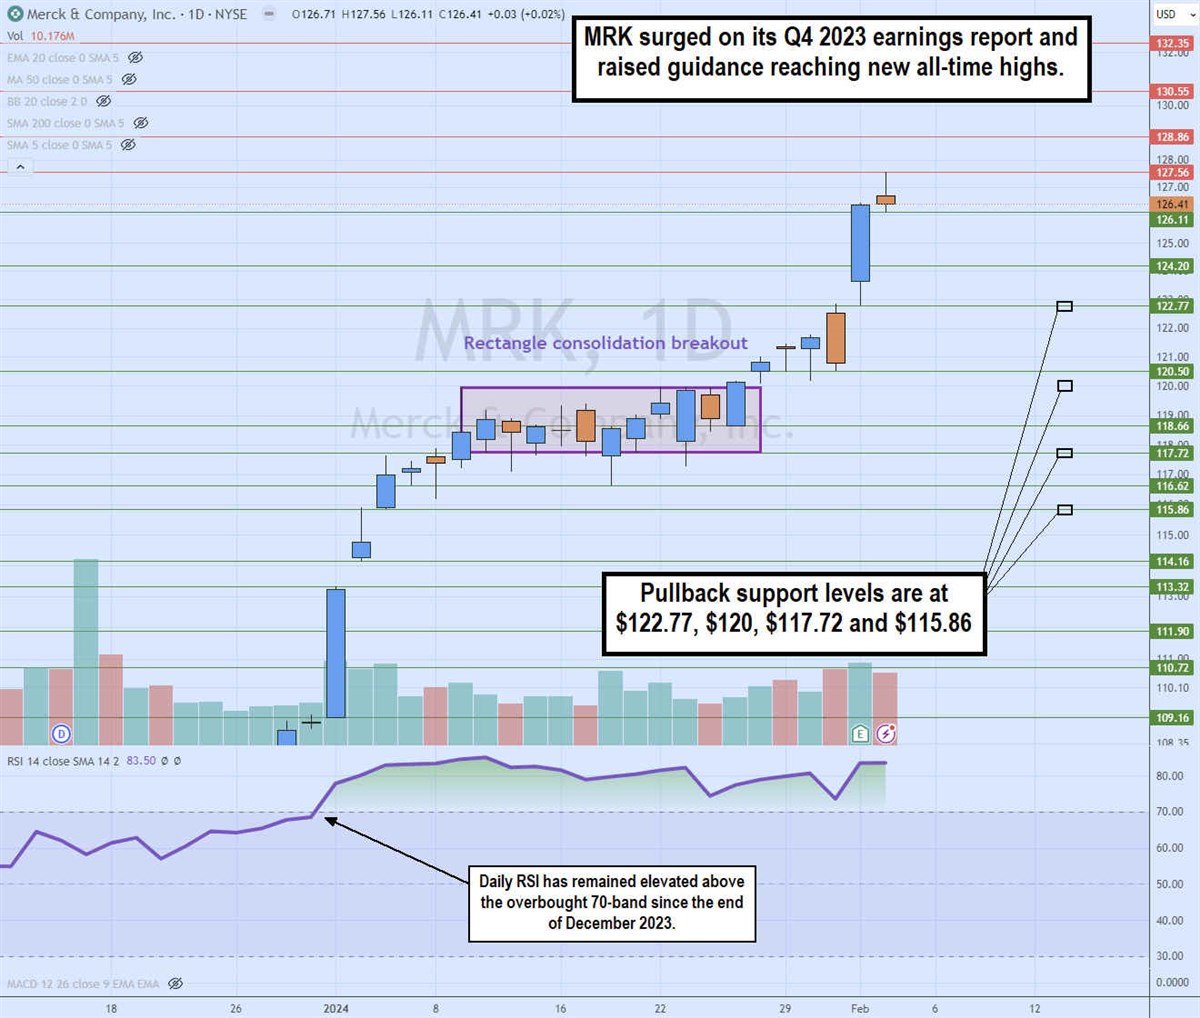
Daily rectangle consolidation breakout
The daily candlestick chart for MRK illustrates a rectangle consolidation breakout pattern. MRK shares surged to $119.97 on January 9, forming a multi-week consolidation in a rectangular trading range between $117.72 and $119.97.
The daily relative strength index (RSI) started the year surging through the 70-band and has remained elevated in an overbought condition since then and is currently at the 83-band. The breakout occurred on January 24 and continued to grind higher, driven by its Q4 2023 earnings release reaching a peak of $127.56. Pullback support levels are $122.77, $120, $117.72 and $115.86.
Seagate Technology Inc.
Seagate Technology PLC (NASDAQ:STX) is the world's largest manufacturer of hard disk drives (HDDs). HDDs are a legacy technology as more and more notebook computers are manufactured without HDDs but solid state drives (SSDs) using flash memory with no moving parts.
However, HDDs are still more cost-effective than SSDs and have more capacity for much cheaper. Seagate has also improved its technology beyond the traditional perpendicular magnetic recording (PMR) technology with heat-assisted magnetic recording (HAMR) technology that can increase HDD capacity two to five times, up to three terabytes (TB) per platter versus 1.3 TB for PMR technology.
Return to profitability, but revenues continue to slide.
Seagate reported fiscal Q2 2024 EPS of 12 cents, beating analyst estimates for a loss of six cents by 18 cents. The company returned to profitability for the first time in a year, indicating the bottom of the prolonged bearish cycle. Revenues fell 17.6% YoY to $1.55 billion, matching consensus analyst estimates.
Flat guidance
The company issued in-line guidance for fiscal Q3 2024 EPS of five cents to 45 cents versus 19 cents analyst estimates. Fiscal Q3 2024 revenues should be between $1.5 billion and $1.8 billion versus $1.64 billion consensus estimates. Get AI-powered insights on MarketBeat.
Built for AI applications and data centers
Its latest Mozaic drives meet the demands of artificial intelligence (AI) CPUs and have started launching.
Seagate Technology CEO Dave Mosley commented, "For context, the latest AI GPUs consume up to 700 watts, which is roughly 100 times more power-intensive than a hard drive operating at maximum performance. Our products can help data center operators store more exabytes using less power and space. For an example to quantify this, a single 32-terabyte Mozaic drive can replace three 10-terabyte drives storing more capacity at 1/3 of the power and footprint."
The company has the right product at the right time, heading into the gradual mass capacity market recovery.
Seagate Technology analyst ratings and price targets are at MarketBeat.
Daily bull flag pattern set-up
The daily candlestick chart on STX illustrates a potential bull flag breakout. The flag started forming after peaking at $92.04 on January 26.
Lower highs and lower lows formed in a parallel channel as the daily MSL trigger formed at $87.51. An MSL trigger breakout will also trigger the daily bull flag. The daily RSI is trying to bounce toward the 60-band. Pullback support levels are at $83.31, $79.39, $76.23 and $73.44.
Southwest Airlines Co.
Major low-cost airline carrier Southwest Airlines Company (NYSE:LUV) has the largest fleet of Boeing (NYSE:BA) Co.'s NYSE: BA 737 MAX planes.
Using these single-aisle jets helps keep maintenance costs low and, with shorter turnaround times, enables more frequent flight departures. The company also doesn't nickel and dime passengers with rescheduling and baggage fees; unlike most carriers, Southwest still offers a two-free checked bags policy. This has allowed them to maintain and grow a loyal following, especially during rising ticket prices.
Blowout quarter
On January 25, Southwest Air reported Q4 2023 EPS of 37 cents, crushing consensus analyst estimates for 12 cents by 25 cents. Revenues rose 10.5% YoY to a record $6.82 billion, beating $6.75 billion consensus estimates.
RASM and ASM forecasts
The company forecasts that Q1 2024 for available seat miles (ASM) will rise to 10% YoY, referring to the number of seats available for passengers to purchase or potential revenue-generating capacity. For example, a 1000-mile flight with 100 seats would equate to 100,000 ASMs.
It forecasts revenue per available seat mile (RASM) to rise 2.5% to 4.5% YoY in Q1 2024. In 2024, ASMs should rise to 6% YoY.
Southwest Airlines CEO Bob Jordan commented, "We completed a comprehensive winter action plan, restored our network, reached full utilization of our fleet, delivered significant new capabilities for our Customers, and had our best fourth quarter completion factor in more than a decade."
Jordan concluded, "Our 2024 plan leverages a set of initiatives which, most importantly, includes better aligning the route network to new demand patterns. While it is early in the first quarter, these initiatives are delivering value, and we expect them to contribute roughly $1.5 billion in incremental year-over-year pre-tax profits. As a result, we expect double-digit year-over-year operating revenue growth and year-over-year operating margin3 expansion."
Southwest Airlines analyst ratings and price targets are at MarketBeat.
Daily ascending triangle pattern and gap and crap
The daily candlestick chart on LUV formed an ascending triangle breakout through the $30.07 flat-top upper trendline on January 24.
The $30.07 is also a daily MSL buy trigger. The Q4 2023 earnings report caused a gap to $32.80 but resulted in a gap and crap as shares sold off back down into the ascending triangle range.
Shares continue to tease a breakout attempt but keep getting sold off back to the triangle upper trendline. Pullback support levels are at $29.41, $28.19, $27.25 and $25.78.