Breaking News
Investing Pro 0
💎 Access the Market Tools Trusted by Thousands of Investors Get Started

Wall St. extends slide with trade and rates in focus

Published Oct 11, 2018 05:02PM ET
Saved. See Saved Items.
This article has already been saved in your Saved Items
 
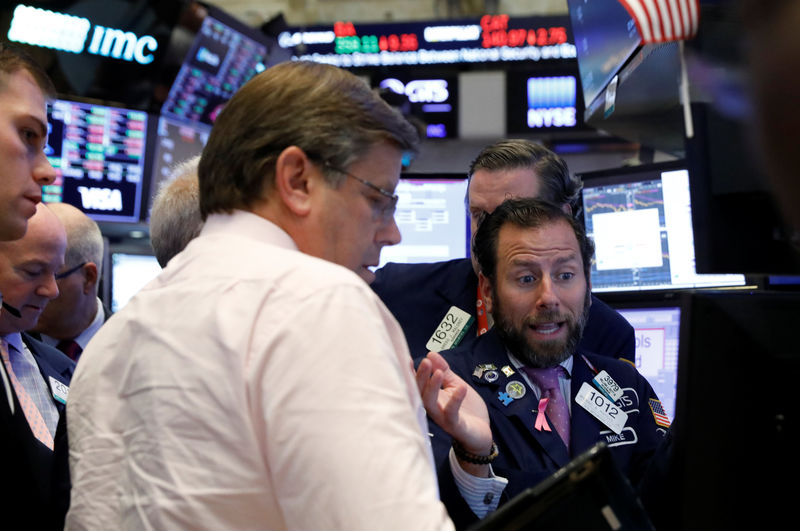
© Reuters. Traders work on the floor of the NYSE in New York
 
US500
-0.14%
Add to/Remove from Watchlist
Add to Watchlist
Add Position

Position added successfully to:

Please name your holdings portfolio
 
DJI
-0.35%
Add to/Remove from Watchlist
Add to Watchlist
Add Position

Position added successfully to:

Please name your holdings portfolio
 
CL
+0.14%
Add to/Remove from Watchlist
Add to Watchlist
Add Position

Position added successfully to:

Please name your holdings portfolio
 
IXIC
-0.11%
Add to/Remove from Watchlist
Add to Watchlist
Add Position

Position added successfully to:

Please name your holdings portfolio
 
VIX
+4.07%
Add to/Remove from Watchlist
Add to Watchlist
Add Position

Position added successfully to:

Please name your holdings portfolio
 

By Sinéad Carew

(Reuters) - Wall Street indexes continued their slide in Thursday's volatile session as investors worried about rising interest rates and braced for a trade war hit to corporate earnings a day ahead of the quarterly reporting season kickoff.

In its sixth consecutive day of declines, the S&P closed down 2.1 percent after shedding 3 percent in Wednesday's session. But at its session low the benchmark fell 2.7 percent to its lowest level since early July.

The Nasdaq narrowly avoided confirming a correction. During the session it fell as much as 10.3 percent from its Aug. 29 closing record high but ended the day 9.6 percent below the record.

Investors worried that equity markets would have trouble recovering as rising interest rates coincide with uncertainty about how much earnings growth would be hurt by a U.S. trade war with China.

"People fear that it will be harder to snap back if we’re seeing a cyclical top in earnings with those two headwinds, which are not going away," said Michael O’Rourke, chief market strategist at JonesTrading in Greenwich, Connecticut.

The Dow Jones Industrial Average fell 545.91 points, or 2.13 percent, to 25,052.83, the S&P 500 lost 57.31 points, or 2.06 percent, to 2,728.37 and the Nasdaq Composite dropped 92.99 points, or 1.25 percent, to 7,329.06.

After hitting an intraday high of 28.84, the CBOE Volatility Index, popularly known as the "fear gauge," ended the day up 2 points at 24.98, its highest close since Feb. 12.

"We saw a rally this morning, and that ended up being a suckers' rally. Then you had buy-the-dippers coming in here saying this was too much too fast," said Dennis Dick, proprietary trader at Bright Trading Llc In Las Vegas.

"Are we out of the woods here? I don't think so," he said. "You're going to see a lot of volatility in the next week or so."

The energy sector, pressured by a drop in oil prices, was the lead decliner, while insurers were some of the biggest losers in the financial sector a day after powerful Hurricane Michael slammed into Florida.

The S&P's 11 major sectors all ended the day in the red with only the communications services sector managing a decline of less than 1 percent.

Energy was the biggest loser with a 3.1 percent drop as oil prices hit two-week lows after an industry report showed a bigger-than-expected build in U.S. crude inventories.[O/R]

The financial sector fell 2.9 percent, also hurt by a 2.7 percent drop in bank stocks a day before three of the biggest banks were to report quarterly results.

Wall Street expects S&P 500 companies to report third-quarter earnings growth of 21.3 percent for the third quarter according to I/B/E/S data from Refinitiv.

The technology sector, the biggest loser in Wednesday's sell-off, closed down 1.3 percent on Thursday.

Stocks had seen some support earlier in the session from U.S. data showing a smaller-than-anticipated rise in consumer prices as it helped ease fears of increasing inflation pressures.

The data helped push U.S. Treasury yields to a one-week low, further soothing equity investors.

But investors still faced a sea of worries, including uncertainty ahead of U.S. midterm congressional elections on Nov. 6, and hawkish comments last week from U.S. Federal Reserve officials.

Declining issues outnumbered advancing ones on the NYSE by a 3.52-to-1 ratio; on Nasdaq, a 2.66-to-1 ratio favored decliners.

The S&P 500 posted no new 52-week highs and 62 new lows; the Nasdaq Composite recorded 6 new highs and 291 new lows.

Volume on U.S. exchanges was 11.44 billion shares, its highest level since Feb. and compared with the 7.65 billion-share average for the full session over the last 20 trading days.
Wall St. extends slide with trade and rates in focus
 

Related Articles

Add a Comment

Comment Guidelines

We encourage you to use comments to engage with other users, share your perspective and ask questions of authors and each other. However, in order to maintain the high level of discourse we’ve all come to value and expect, please keep the following criteria in mind:  

  •            Enrich the conversation, don’t trash it.

  •           Stay focused and on track. Only post material that’s relevant to the topic being discussed. 

  •           Be respectful. Even negative opinions can be framed positively and diplomatically. Avoid profanity, slander or personal attacks directed at an author or another user. Racism, sexism and other forms of discrimination will not be tolerated.

  • Use standard writing style. Include punctuation and upper and lower cases. Comments that are written in all caps and contain excessive use of symbols will be removed.
  • NOTE: Spam and/or promotional messages and comments containing links will be removed. Phone numbers, email addresses, links to personal or business websites, Skype/Telegram/WhatsApp etc. addresses (including links to groups) will also be removed; self-promotional material or business-related solicitations or PR (ie, contact me for signals/advice etc.), and/or any other comment that contains personal contact specifcs or advertising will be removed as well. In addition, any of the above-mentioned violations may result in suspension of your account.
  • Doxxing. We do not allow any sharing of private or personal contact or other information about any individual or organization. This will result in immediate suspension of the commentor and his or her account.
  • Don’t monopolize the conversation. We appreciate passion and conviction, but we also strongly believe in giving everyone a chance to air their point of view. Therefore, in addition to civil interaction, we expect commenters to offer their opinions succinctly and thoughtfully, but not so repeatedly that others are annoyed or offended. If we receive complaints about individuals who take over a thread or forum, we reserve the right to ban them from the site, without recourse.
  • Only English comments will be allowed.
  • Any comment you publish, together with your investing.com profile, will be public on investing.com and may be indexed and available through third party search engines, such as Google.

Perpetrators of spam or abuse will be deleted from the site and prohibited from future registration at Investing.com’s discretion.

Write your thoughts here
 
Are you sure you want to delete this chart?
 
Post
Post also to:
 
Replace the attached chart with a new chart ?
1000
Your ability to comment is currently suspended due to negative user reports. Your status will be reviewed by our moderators.
Please wait a minute before you try to comment again.
Thanks for your comment. Please note that all comments are pending until approved by our moderators. It may therefore take some time before it appears on our website.
Comments (5)
Zack Ong
Zack Ong Oct 12, 2018 3:02AM ET
Saved. See Saved Items.
This comment has already been saved in your Saved Items
as proof i said 11hours ago,didnt asia markets gap down and go all the way up?
Mojo Snake
Mojo Snake Oct 11, 2018 2:49PM ET
Saved. See Saved Items.
This comment has already been saved in your Saved Items
What bounce?
Sevantilal Patel
Sevantilal Patel Oct 11, 2018 12:15PM ET
Saved. See Saved Items.
This comment has already been saved in your Saved Items
fed and treasury selling bonds like there is no tomorrow. liquidity is tight and getting tighter. but this may be a better way to avoid an eventual big ******off.
Samuil Shenker
Samuil Shenker Oct 11, 2018 12:07PM ET
Saved. See Saved Items.
This comment has already been saved in your Saved Items
Next stop is ES 2600
Fabrice Prop trader
Fabrice Prop trader Oct 11, 2018 9:06AM ET
Saved. See Saved Items.
This comment has already been saved in your Saved Items
long !
 
Are you sure you want to delete this chart?
 
Post
 
Replace the attached chart with a new chart ?
1000
Your ability to comment is currently suspended due to negative user reports. Your status will be reviewed by our moderators.
Please wait a minute before you try to comment again.
Add Chart to Comment
Confirm Block

Are you sure you want to block %USER_NAME%?

By doing so, you and %USER_NAME% will not be able to see any of each other's Investing.com's posts.

%USER_NAME% was successfully added to your Block List

Since you’ve just unblocked this person, you must wait 48 hours before renewing the block.

Report this comment

I feel that this comment is:

Comment flagged

Thank You!

Your report has been sent to our moderators for review
Continue with Google
or
Sign up with Email