“Is the bear market over? Not by a long shot. The longer this rally continues, the more people are going to be fooled that happy days are here again,” says Jeff Greenblatt, Director, Lucas Wave International, LLC
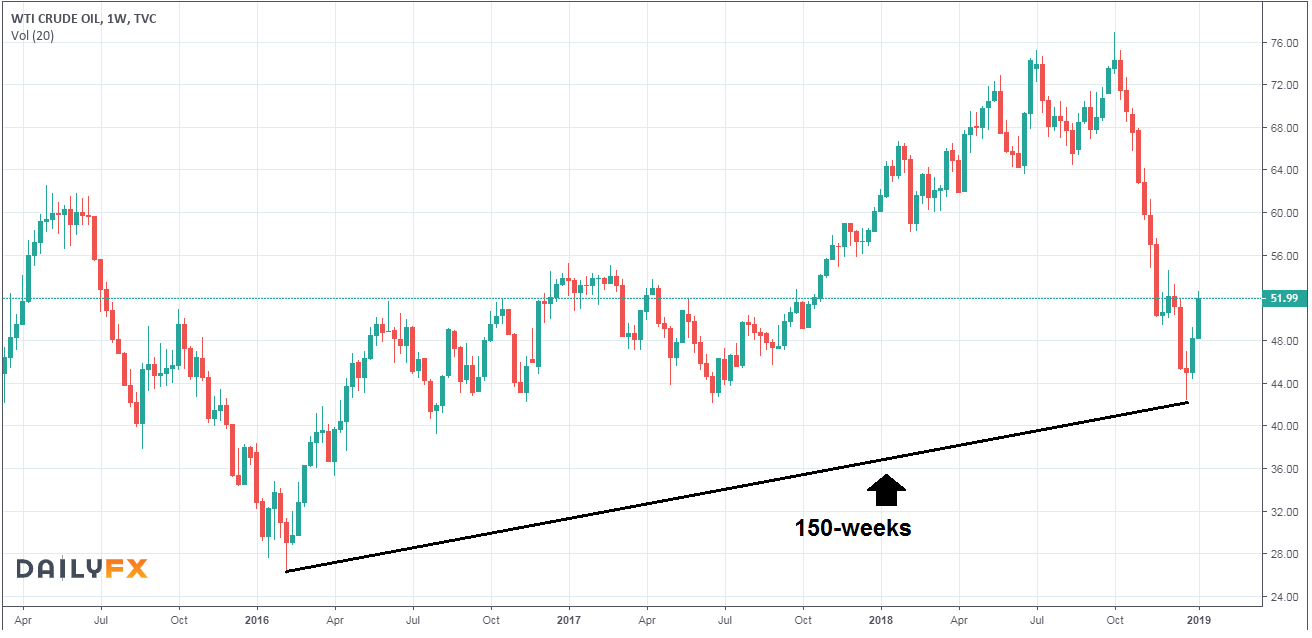
In recent weeks we’ve been watching the intermediate- to long-term oil chart respond to square out vibrations over the past three years. A move of $50.85 higher from the February 2016 low to the November 2018 high followed by the recent implosion and possible low measures150 weeks (see chart). Finally, on Wednesday it broke through, violating a bunch of other relationships that could have caused at least a consolidation or shake out of the weak hands.
Source: TradingView and Forex.com
Are any other charts responding to at least intermediate term square out vibrations? There are. Let’s look at the Aussie dollar, which often moves against the greenback (see chart below). This time the U.S. Dollar has done well enough on its own to roll over, but it could get more wind at its back with the Aussie dollar changing direction. Thus far, it looks great. At 155 weeks to the 2016 low, the high on the weekly continuation is .8156, and on a square of 9 the reading is 13.855dg down.
The long bond is also starting to work on the weekly time frame as well. If bond prices continue to sink, it will help the stock market immensely on a rotation out of bonds. Let’s talk about these vibrational square outs. It was about 100 years ago Gann stated when price and time square out, the pattern changes direction. That could be anywhere from successful scalping on a one-minute E-mini chart or the calculations for the long-term top in the stock market which I showed you back in October. This is what drives the bus as far as financial markets are concerned. Why hasn’t this methodology taken off over the years?
Traders fail for a lack of knowledge. The prevailing wisdom in the Gann community is such that a stock at 30 could go to 60 in 30 days, weeks or months. This hypothesis works, to a degree. In years past I found a handful of these types of moves in a month. For instance, back in 2010 the KBW Nasdaq Bank Index (BKX) peaked at 58.81 in 59 weeks. Here’s a picture of that action (see chart below).
Additionally, the high at 58.81 has a square root of 7.66. The vibration also works as the bottom was 17.76
At the time I didn’t think it was a methodology that was relevant in the 21st century. Then about four years ago I stumbled into these vibrations in a much bigger way. Not only does price and time square out, but price and/or time squares out with retracements. Price and/or time will also square out with the Gann square of 9 calculations.
It just depends how creative you allow yourself to be. In recent posts I’ve shown you how these vibrational square outs work on an intraday chart. The recent oil example and now the Aussie dollar show how this can be applied to the larger degree trend. At the New York Traders Expo in March, I will go into great detail about how this works. I call it Kairos because it represents the most opportune moment when you have the greatest edge against the person on the other side of your trade.
Since the NYSE Arca Oil Index (XOI) found the low thanks to help from the commodity itself, it has helped the stock market rebound from one of the worst Santa seasons not only in recent memory but stock market history. Until the market decided to rally the day after Christmas, many stated the market was on a path to the worst December since 1931. Yes, it did find the low but the concern going forward is the market has bottomed during the low volume holiday season.
Traders who follow sentiment/psychology are always looking for the fear to go off the charts in order to find the bottom. We haven’t seen that yet. But what seems to have happened is the crowd got alarmed to see how poor the market performed on Christmas Eve which was a low trading volume half day session. For that reason, I believe the low is vulnerable. The rally may even be vulnerable right here. Wednesday is the 89th trading day to the top in the NASDAQ back on August 30. True, this is not an absolute high or low but the Fibonacci 89-day window can still exert influence on the pattern.
What should happen going forward?
This is a bear market rally. To give you an idea, after the 9/11 bottom back in 2001 the market followed through on a six-month rally. But consider from March 2000 the bear had aged 18 months by that point. Using the NASDAQ as a guide, the current bear market— thus far— from high to low is 79 trading days. If this rally hits 38% in terms of time, it should last around 30 trading days. The NASDAQ is only at 10 trading days right now. It may need some serious upper testing before the next leg down commences.
How can I be so sure there will be another leg down? I’ve spent the past year tying all of the crazy domestic and international politics to the markets. This is a market that most closely resembles the late 1930s. The retest of the Great Depression low didn’t materialize until 1942, which meant it was a three-year bear market. I’m not saying this bear is going to last three years.
Here is what I am saying.
Several years ago, I saw a Time magazine article from the first half of 1942 that stated German military production had peaked while America was only about 20-25% of its capacity. The German’s capability to wage war had peaked while we were just getting warmed up. The 1942 bottom materialized around the same time.
Is there anyone reading this who believes the insanity in the 24/7 news cycle is peaking right now? Your answer to that question should determine whether you believe the bear has run its course. Recently I’ve discussed The Fourth Turning, a book by William Strauss and Neil Howe. This is not a book about stock market cycles but the authors have done a masterful job of identifying the generational turns that last around 80 years. Recently I saw an old CSPAN interview from back in the late 1990s where the authors basically predicted what we are going through right now. This cycle is unlike any other we’ve seen as investors or traders. That’s a safe assumption since its not likely you were trading the market during World War II.
Is the bear market over? Not by a long shot, but then again markets don’t go straight up or down. The longer this rally continues, the more people are going to be