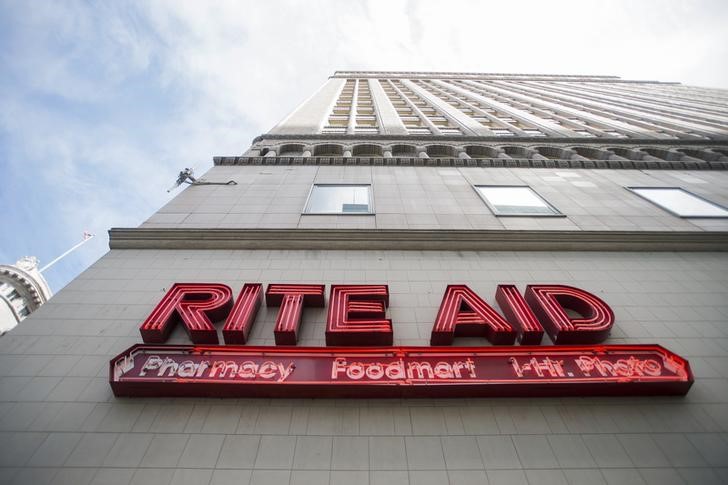
Rite Aid (NYSE:RAD) reported Q4 EPS of ($1.63), $1.07 worse than the analyst estimate of ($0.56). Revenue for the quarter came in at $6.07 billion versus the consensus estimate of $5.95 billion.
GUIDANCE:
Rite Aid sees FY2023 EPS of ($0.53)-($1.06), versus the consensus of ($1.36). Rite Aid sees FY2023 revenue of $23.1-23.5 billion, versus the consensus of $23.45 billion.
- The Company’s outlook for Fiscal 2023 takes into account an expected reduction in benefit from COVID vaccinations and a reduction in revenues at Elixir, offset by anticipated benefit from initiatives to increase retail sales and non-COVID related prescriptions. The outlook also assumes improvements in front end margin driven by changes in our loyalty program, greater owned brand penetration and expected expansion in gross margin at Elixir due to our new rebate arrangement, offset by continuing reimbursement rate pressure. We will significantly reduce costs through our closure of a total of 145 unprofitable stores (which includes the 63 announced last quarter), a reduction in corporate administrative expenses and improved efficiencies in worked payroll and other store labor costs. We have also reduced expenses at Elixir associated with our reduction in membership. We expect these cost initiatives to drive savings of $170 million in Fiscal 2023.
- In addition, the following Fiscal 2023 outlook is forward-looking subject to a range of assumptions and uncertainties described below and in documents that we file or furnish with the Securities and Exchange Commission the (“SEC”).
- Total revenues are expected to be between $23.1 billion and $23.5 billion in fiscal 2023. Retail Pharmacy Segment revenue is expected to be between $17.7 billion and $18.0 billion and Pharmacy Services Segment revenue is expected to be between $5.4 billion and $5.5 billion (net of any intercompany revenues to the Retail Pharmacy Segment).
- Net loss is expected to be between $167 million and $210 million.
- Adjusted EBITDA is expected to be between $460 million and $500 million. Retail Pharmacy Segment Adjusted EBITDA is expected to be between $320 million and $350 million and Pharmacy Services Segment Adjusted EBITDA is expected to be between $140 million and $150 million.
- Adjusted net loss per share is expected to be between $(0.53) and $(1.06).
- Capital expenditures are expected to be approximately $250 million, with a focus on investments in digital capabilities, technology, prescription file purchases, distribution center automation and store remodels. We expect to generate positive free cash flow in Fiscal 2023.
For earnings history and earnings-related data on Rite Aid (RAD) click here.
