Breaking News
Investing Pro 0
🙌 It's Here: the Only Stock Screener You'll Ever Need Get Started

Slumping U.S. stock market technical indicators flash warning sign

Published Sep 09, 2022 01:10AM ET Updated Sep 09, 2022 10:32AM ET
Saved. See Saved Items.
This article has already been saved in your Saved Items
 
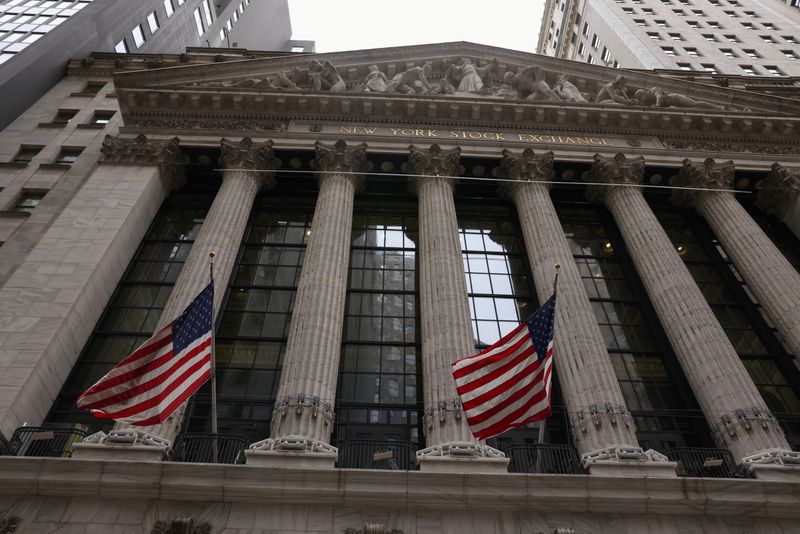
© Reuters. Flags are seen outside the New York Stock Exchange (NYSE) in New York City, where markets roiled after Russia continues to attack Ukraine, in New York, U.S., February 24, 2022. REUTERS/Caitlin Ochs/File Photo
 
US500
+0.62%
Add to/Remove from Watchlist
Add to Watchlist
Add Position

Position added successfully to:

Please name your holdings portfolio
 
NXGN
0.00%
Add to/Remove from Watchlist
Add to Watchlist
Add Position

Position added successfully to:

Please name your holdings portfolio
 
IXIC
+1.02%
Add to/Remove from Watchlist
Add to Watchlist
Add Position

Position added successfully to:

Please name your holdings portfolio
 

By Saqib Iqbal Ahmed

NEW YORK (Reuters) - Indicators that investors use to gauge the health of the U.S. stock market have taken a turn for the worse, fueling worries that the benchmark index may revisit its mid-June bear market low.

The S&P 500 is down 7% since mid-August following a sharp summer rally, battered by expectations that the Federal Reserve will raise rates higher than previously anticipated in its fight to bring down consumer prices from their 40-year highs.

The retreat in stocks has given more reason for caution to those who track market phenomena such as breadth, momentum and trading patterns to inform their investment decisions. While many of these indicators were painting an optimistic picture just a few weeks ago, they tell a less bullish story now, raising worries that this year’s selloff in markets may not be over.

"I had to downgrade the market technically, given how severe the decline has been over the last three weeks," said John Kolovos, chief technical strategist at Macro Risk Advisors.

"The odds of a market bottom being struck back in June have diminished to that of just slightly better than a flip of a coin at this juncture."

GRAPHIC: Russell 3000 pullback https://graphics.reuters.com/USA-STOCKS/xmpjoalzxvr/chart.png

Among the factors investors study is market breadth, which shows whether a significant amount of stocks are rising or falling in unison. Positive market breadth, when more stocks are advancing than declining, points to a high degree of confidence among stock bulls.

Recently, market breadth has started to send worrying signals. The percentage of stocks trading above their 50-day moving average in the Russell 3000 has fallen to about 30%, from around 86% in mid-August.

"We want to see this indicator stabilize where it is right around now," Kolovos said. "We really don't want to see it get much lower than 25%."

GRAPHIC: Stocks at 3-month lows https://graphics.reuters.com/USA-STOCKS/klpykadagpg/chart.png

Meanwhile, the 15-day moving average of the percentage of S&P 500 stocks hitting fresh three-month lows - another measure of stock market breadth - has climbed to about 10% from just above zero in mid-August, according to data from Thrasher Analytics. It stood at around 60% during the market low in June.

"We're watching if we continue to see an expansion in bearish breadth," said Andrew Thrasher, the firm’s founder. "If we see expanding new lows that will put downside pressure on the index."

GRAPHIC: Lower for longer https://fingfx.thomsonreuters.com/gfx/mkt/znvnewlekpl/Pasted%20image%201662660473627.png

Additionally, the S&P 500 Index has lingered below its 200-day moving average for five months now, the longest such streak since May 2009.

Historically, the index has returned -3.56% in September when it is below the 200-day moving average during a year in which the United States holds midterm elections, as it will in 2022, according to BofA Global Research. The index is up around 1% month-to-date.

GRAPHIC: Head and shoulders top https://fingfx.thomsonreuters.com/gfx/mkt/dwpkrxeyzvm/Pasted%20image%201662558014008.png

Tech stocks have been hit particularly hard in recent weeks, with the tech-heavy Nasdaq Composite down about 10% since mid-August.

Some chart-watchers see more trouble ahead for the index, which recently formed a bullish-to-bearish trend reversal known as a "head and shoulders top."

The index already broke the so-called neckline of the head and shoulders formation earlier this year, a bearish development. A drop through its recent low of around 10,500 could open the Nasdaq up to a move to 8,800, ICAP (LON:NXGN) analyst Brian LaRose said. The index closed on Thursday 11,862.

GRAPHIC: Yields up, stocks down https://fingfx.thomsonreuters.com/gfx/mkt/jnpwemxmopw/Pasted%20image%201662580713944.png

Of course, technicals can improve or worsen as markets gyrate and investors adjust expectations based on factors such as the trajectory of bond yields, which are driven by monetary policy expectations and have closely tracked the performance of stocks this year.

The yield on the benchmark 10-year Treasury hit a peak of nearly 3.5% on June 14, just before the S&P 500 hit its recent low.

While stocks rebounded as yields dipped over the summer, a recent bounce in yields has accompanied the downturn in equities this month, with the 10-year yield now around its highest level since June 16.

Meanwhile, real yields, which strip out inflation and are seen as a key driver of risk asset prices, earlier this week stood at 0.88%, near their highest level since 2019.

Yields have "huge implications for what could happen in the next few months," said Mark Newton, technical strategist at Fundstrat. "My own my thinking is that yields are very close to a peak and should start to roll over."
Slumping U.S. stock market technical indicators flash warning sign
 

Related Articles

Add a Comment

Comment Guidelines

We encourage you to use comments to engage with other users, share your perspective and ask questions of authors and each other. However, in order to maintain the high level of discourse we’ve all come to value and expect, please keep the following criteria in mind:  

  •            Enrich the conversation, don’t trash it.

  •           Stay focused and on track. Only post material that’s relevant to the topic being discussed. 

  •           Be respectful. Even negative opinions can be framed positively and diplomatically. Avoid profanity, slander or personal attacks directed at an author or another user. Racism, sexism and other forms of discrimination will not be tolerated.

  • Use standard writing style. Include punctuation and upper and lower cases. Comments that are written in all caps and contain excessive use of symbols will be removed.
  • NOTE: Spam and/or promotional messages and comments containing links will be removed. Phone numbers, email addresses, links to personal or business websites, Skype/Telegram/WhatsApp etc. addresses (including links to groups) will also be removed; self-promotional material or business-related solicitations or PR (ie, contact me for signals/advice etc.), and/or any other comment that contains personal contact specifcs or advertising will be removed as well. In addition, any of the above-mentioned violations may result in suspension of your account.
  • Doxxing. We do not allow any sharing of private or personal contact or other information about any individual or organization. This will result in immediate suspension of the commentor and his or her account.
  • Don’t monopolize the conversation. We appreciate passion and conviction, but we also strongly believe in giving everyone a chance to air their point of view. Therefore, in addition to civil interaction, we expect commenters to offer their opinions succinctly and thoughtfully, but not so repeatedly that others are annoyed or offended. If we receive complaints about individuals who take over a thread or forum, we reserve the right to ban them from the site, without recourse.
  • Only English comments will be allowed.
  • Any comment you publish, together with your investing.com profile, will be public on investing.com and may be indexed and available through third party search engines, such as Google.

Perpetrators of spam or abuse will be deleted from the site and prohibited from future registration at Investing.com’s discretion.

Write your thoughts here
 
Are you sure you want to delete this chart?
 
Post
Post also to:
 
Replace the attached chart with a new chart ?
1000
Your ability to comment is currently suspended due to negative user reports. Your status will be reviewed by our moderators.
Please wait a minute before you try to comment again.
Thanks for your comment. Please note that all comments are pending until approved by our moderators. It may therefore take some time before it appears on our website.
Comments (5)
Dave Jones
Dave Jones Sep 09, 2022 2:06PM ET
Saved. See Saved Items.
This comment has already been saved in your Saved Items
As soon as you see articles like this you can guarantee that the market will soar higher.
Dennis Chuck
Dennis Chuck Sep 09, 2022 1:48PM ET
Saved. See Saved Items.
This comment has already been saved in your Saved Items
They want you to dump, so they can buy cheap. Neber trust the funds!
Vito Tagliano
Vito Tagliano Sep 09, 2022 11:11AM ET
Saved. See Saved Items.
This comment has already been saved in your Saved Items
It’s a classic Pump & Dump. Markets are getting weaker, Interest rates hike by 4% by December, liquid cash getting extracted from households, middle class looking for second job…. These are on the ground warning signs
Nancy LangwiserKear
Nancy LangwiserKear Sep 09, 2022 11:11AM ET
Saved. See Saved Items.
This comment has already been saved in your Saved Items
I agree. It’s a market of weak holders, most of whom seem to be continuing to continue to click their ruby slippers and hope they will return to OZ. Unfortunately, the future looks more like the Dust Bowl in the 1930’s. 😶‍🌫️
S S Shet
pingo_0070 Sep 09, 2022 10:37AM ET
Saved. See Saved Items.
This comment has already been saved in your Saved Items
don't listen to these buggers .. just hold on .. they want you to sell in panic ..
Maks Mars
Maks Mars Sep 09, 2022 10:37AM ET
Saved. See Saved Items.
This comment has already been saved in your Saved Items
hedge funds are buying big lol
Joe Rizzuto
Joe Rizzuto Sep 09, 2022 7:17AM ET
Saved. See Saved Items.
This comment has already been saved in your Saved Items
very scary... do not invest when everything *** wait for everything to be great again then invest when stocks are twice as high!
 
Are you sure you want to delete this chart?
 
Post
 
Replace the attached chart with a new chart ?
1000
Your ability to comment is currently suspended due to negative user reports. Your status will be reviewed by our moderators.
Please wait a minute before you try to comment again.
Add Chart to Comment
Confirm Block

Are you sure you want to block %USER_NAME%?

By doing so, you and %USER_NAME% will not be able to see any of each other's Investing.com's posts.

%USER_NAME% was successfully added to your Block List

Since you’ve just unblocked this person, you must wait 48 hours before renewing the block.

Report this comment

I feel that this comment is:

Comment flagged

Thank You!

Your report has been sent to our moderators for review
Continue with Google
or
Sign up with Email