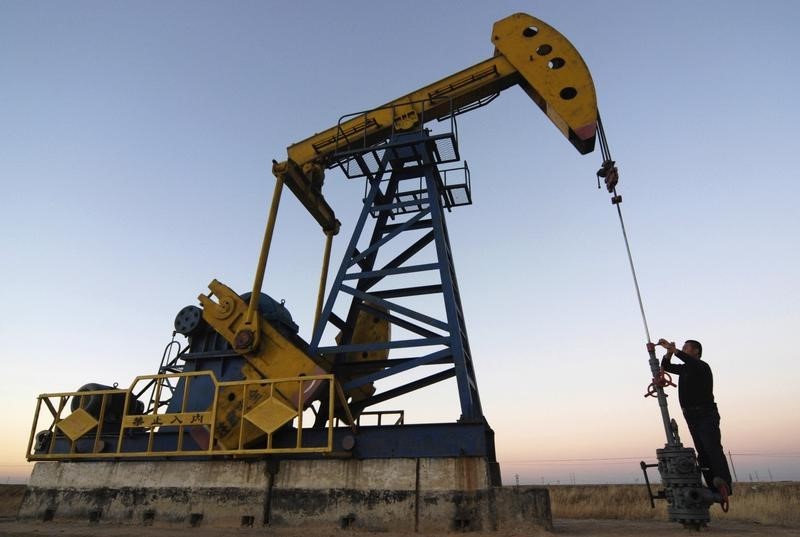
Investing.com -- The news came as quietly as it could on a Friday afternoon and passed without any discernible impact. And understandably too: The U.S. oil rig count went up by one last week, after a drop of 127 over the past year.
But there was a significance to the story. It was the first time since June that U.S. energy firms increased the number of rigs actively drilling for oil in the country, according to a weekly update of the rig count by oil services firm Baker Hughes.
One oil rig, of course, means nothing — particularly if the count drops back the following week, and by a far greater amount.
But it could mean something if there’s a steady climb hereon.
If not anything else, a steady, albeit slow, climb will challenge the argument made day in and out by those convinced that this year’s near-20% slump in rigs will soon cause a tumble in U.S. crude production.
That argument has grown despite the U.S. Energy Information Administration, or EIA, adjusting upward its estimate on crude production to three-year highs of 12.8 million barrels per day in recent weeks, from 12.2 million at the end of July.
The EIA’s revisions came after it raised its production for U.S. crude under a new reporting methodology that took into account crude flowing from active oil wells compared with those that are drilled but uncompleted — the latter referred to as DUCs.
The revisions imply that active drilling rigs were about 10% more productive in 2021–2022 than previously estimated. Such drilling-rig productivity or efficiency would offset to some extent this year’s sheer drop in the rig count.
The EIA’s new methodology is, however, vehemently opposed by those who are long-oil, or wagering for crude prices to rise.
“The reality is that the trajectory of future US oil production would beak and the supply side would start to drain and that is happening,” said Phil Flynn, an energy analyst at Chicago’s Price Futures Group, whose many followers are made up of those who are long oil.
The rig count remains one of the crucial indicators of oil production. But even so, it’s a lagging indicator that could take months to show up in actual production. This may be why the EIA’s crude production estimates haven’t ticked down yet as the falling rig count hasn’t made a commensurate impact on U.S. crude.
But then again, we have to consider the EIA’s explanation about the higher drilling efficiency for the remaining active wells, a phenomenon that could well challenge any argument about falling rigs.
There are many who contend that the EIA is going about the whole thing wrongly, and for devious reasons too, they say. Their theory is based on the conspiracy of an entire U.S. energy department working in cahoots with the White House to cook up numbers on drilling efficiency. The accusation does not seem to take into account career professionals at the department who’ve dedicated their lives working for the betterment of the energy sector and the data integrity that’s sacrosanct to their work.
But there are also economists like Adam Button, who while bullish on oil, are pragmatic about the lift current crude prices can provide to production.
“It's tough to see how U.S. oil production is higher at the end of next year if this doesn't turn around quickly,” Button said, referring to the oil rig count, in a blog on the ForexLive platform on Friday.
He, however, added: “There is plenty of talk about discipline among U.S. oil producers but $87 oil has a way of eroding that.”
The last line was in reference to the pre-weekend settlement for U.S. crude, which in March stood at a low of beneath $65.
Oil: Market Settlements and Activity
Oil prices rose for a second week in a row on Friday as traders hedged against supply insecurities, ramped up by concerns that Saudi Arabia and Russia will be removing a combined 1.3 million barrels per day from the market till the year-end.
Both New York-traded WTI, or West Texas Intermediate, crude and its London-based peer, Brent, reversed Thursday’s drop of close to 1% as the weekend approached.
WTI did a final trade of $87.23 on Friday after officially settling the session at $87.51 per barrel, up 64 cents, or 0.7%, on the day. The U.S. crude benchmark hit a 10-month peak of $88.09 on Wednesday. With a net gain in three days versus two, WTI rose 2.2% on the week, extending the prior week’s 7.2% rally.
Brent did a final trade of $90.44 on Friday after officially settling the session at $90.65, up 73 cents, or 0.8%, on the day, recapturing the $90 handle which it momentarily lost for the first time on Thursday after gaining it on Tuesday. For the week, the global oil benchmark rose 2.4%, extending the prior week’s 4.8% gain.
Brent's rise to above $90 came with less than three weeks left of summer, the season Americans like driving the most. With the fall season of lower oil usage set to begin on Sept. 23, crude prices would typically retreat a little, sometimes meaningfully, in the world’s largest consuming country.
But that may not happen this time, not with Saudi Arabia’s target of ultimately getting oil to $100 a barrel or beyond. The Saudis, who control much of the world’s oil exports, have been trying to bring oil back to triple-digit pricing since losing that advantage in August 2022, when Brent crude hovered above $105 a barrel.
Key to this is the 1 million barrels per day in additional cuts, on top of other existing production rationing, that the Saudis have been carrying out since July. By extending this till the year-end — and widening it with the help of Moscow which will cut 300,000 barrels per day of Russian production — the kingdom is hoping to create a different sort of market phenomenon for pricing.
Fear of less oil for the market to play with was playing on traders’ minds, particularly with the approach of the weekend which tends to put the market on a hedging overdrive, said analysts.
“Oil prices have consolidated a little as we’ve moved through the week but the trend remains very positive for crude, backed once again by the decision from Saudi Arabia and Russia to extend supply restrictions to the end of the year,” observed Craig Erlam, analyst at online trading platform OANDA.
“A lot more oil [is] off the market at a time when it’s clearly quite tight, albeit with a global economic outlook that is highly uncertain. Demand may still wane but traders appear to be working on the assumption of soft landings and mild recessions at worst. China is another unknown with slow and steady growth, by its standards, looking like the path ahead.”
Data on Thursday showed overall Chinese exports and imports fell in August, as sagging overseas demand and weak consumer spending squeezed businesses.
However, even in times of lackluster economic activity, China tends to bolster its storage capacity, particularly with the availability of cheap Russian crude. Last month, Chinese crude imports rose nearly 31%.
Meanwhile, questions remain about whether central banks in the United States and Europe will continue their aggressive interest rate hike campaigns to tame persistent inflation.
The Saudis are “acutely aware of the tightrope” which they walk between tight supplies and the limited progress in fighting achieved by central banks, said John Evans at oil broker PVM.
Oil: WTI Technical Outlook
WTI’s close of above the 100-week SMA, or Simple Moving Average, statically aligns with the $85.90 support, adding more fuel to its bullish bias, said Sunil Kumar Dixit, technical strategist at SKCharting.com.
As long as the momentum in the U.S. crude benchmark maintains stability at above the 5-day EMA, or Exponential Moving Average dynamically positioned at $86.60, “oil bears will have to remain in the waiting lounge”, Dixit remarked.
He, however, cautions that the ride up will probably be smaller after this.
“It should be noted that the aforementioned 5-day EMA is the first line of defense for the longs,” Dixit said. “There is limited room for immediate upward advance towards the initial resistance of $88.50 and $89.50, before WTI’s embarkation towards major overhead resistance at $96.”
Weakness in chasing the heights can be witnessed if $89.50 proves to be a resistance as well, which may gain affirmation with a close below the 5-day EMA, said Dixit.
“Such downward consolidation below the 5-Day EMA will aim for a drop towards the horizontal support of $84.90 - $84.40,” he said. “If this support area fails, we can expect a drop to $83.70 and $82.80.”
Gold: Market Settlements and Activity
The prospect of gold breaking out solely on a Fed pause in rates was challenged again this week as the yellow metal posted a weekly loss as its nemesis, the dollar, shot up instead.
In Friday’s trade, gold futures’ most-active December contract did a final trade of $1,942.60 an ounce, after officially settling the session at $1,942.70, up 20 cents on the day. Yet, losses in three prior sessions after Monday’s U.S. Labor Day holiday meant a negative week for gold futures, which finished the five-day period down by a net 1.2%, practically giving back the previous week’s 1.3% gain.
The spot price of gold, which is more closely followed than futures by some traders, settled at $1,919.15, down 57 cents, or 0.03%. For the week, the spot price, which is reflective of real-time trades in bullion, was down 1.1% versus the prior week’s 1.3% gain.
The previous week’s gain came on the back of the U.S.non-farm payrolls report for August, which saw unemployment tick up to 3.8% from July’s 3.5% despite a gain of 187,000 jobs versus the forecast 170,000. The higher jobless rate reinforced the notion that the Fed will hold rates unchanged when it meets on Sept. 20 to review U.S. monetary policy, sending gold momentarily higher last week.
But as this week began, speculation resurfaced of the Fed exercising another rate hike or more before the end of the year, in its bid to bring inflation to its annual target of 2%.
Inflation, measured by the Consumer Price Index, or CPI, fell from a four-decade high of more than 9% per annum in June 2022 to as low as 3% in June this year. But as of July, it began to perk again, reaching 3.2%. That raised the possibility of the Fed, which has already added 5% to interest rates over the past 18 months, to turn aggressive again on monetary policy. That sent the Dollar Index to six-month highs.
Since the latest non-farm payrolls surfaced a week ago, the spot price of gold has moved just about $15 an ounce, going from a settlement of just below $1,940 on Sept. 1 to trade in a range of between $1,920 and $1,925 in the latest session.
Gold chartist Sunil Kumar Dixit said the same $15 play is what the spot price needs to crack in order for a new price direction to emerge.
Paramount to the bears in gold now is a push of the spot price beneath the key $1,1915 support, said Dixit.
For the longs, it’s a clear break above the $1,930 resistance, he said.
“Gold has had another interesting week, with last Friday’s jobs report feeling like a distant memory,” said Ed Moya, analyst at online trading platform OANDA. “It didn’t give it anything like the boost that it appeared it would on the basis of the numbers themselves, almost all of which looked very favorable.”
Moya noted that gold’s slide this week also came on the back of U.S. economic data suggesting that a soft landing, rather than a hard recession, could be the scenario for the world’s largest economy by the end of the year.
“Perhaps the yellow metal has found steady ground in the $1,900-$1,950 region as we await next week’s inflation data and the Fed meeting the following week,” he said, referring to the upcoming August update of the CPI and the rate decision of the central bank.
Gold: Spot Price Outlook
Spot gold’s bounce back from the $1,915 confluence support zone, marked by the Daily Middle Bollinger and the 200-day SMA, met with resistance at the 50-day EMA of $1,930, resulting in a drop to $1,917, SKCharting’s Dixit noted.
“The bulls have however a ray of hope with settlement above the mentioned inflection point for resuming an upward advance to retest $1,930,” said Dixit. “Clearing through this zone will put spot gold back on the bullish path for $1,940-$1,948.”
Strong acceptance above $1,948 will also favor the next leg higher at $1,971-$1,975, he said.
“If this support cluster fails to hold, we are likely to see gold dropping to $1,910, followed by the 50-week EMA of $1,899. A break below $1,899 opens the way for deeper losses.”
Major downside support was seen at the monthly Middle Bollinger Band of $1,858, he added.
Natural gas: Market Settlements and Activity
The front-month October gas contract on the New York Mercantile Exchange’s Henry Hub did a final trade of $2.618 per mmBtu, or million metric British thermal units on Friday after officially settling the session at $2.605, up 2.6 cents or 1%.
For the week though, October gas fell 16 cents, or 5.8%.
Natural gas: Technical Outlook
Natural Gas continues to coil within a narrowing range of the 100-day SMA of $2.51 which acts as horizontal support and the $2.70 level, which serves as resistance, said SKCharting’s Dixit.
“The market appears to be waiting for a break above the descending 200-day SMA of $2.90,” Dixit said. “Above $2.90 and $3.00, the next resistance levels would be $3.17 and $3.24.”
But a break below $2.50 will turn the short-term trend in gas back towards bearish, with a downside potential retest at $2.25 and $2.00, he said.
Disclaimer: Barani Krishnan does not hold positions in the commodities and securities he writes about.