By Barani Krishnan
Investing.com - Looks like oil bears are defying OPEC+ again. And looks like OPEC+ will do the predictable thing again.
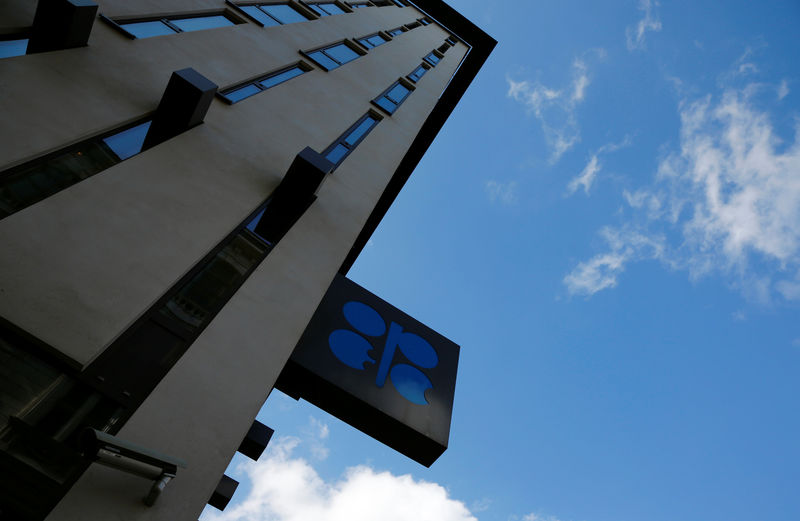
Crude prices had their first weekly decline in five as persistent U.S. rate hike and recession fears ended a rally in place since the 13-member Saudi-led Organization of the Petroleum Exporting Countries and their 10 independent allies steered by Russia devised an output maneuver to rescue the market from 15-month lows.
The price move in the just-ended week wasn’t too large, with the drop being less than 6% — versus the four previous weeks when WTI rallied a total of 24% and Brent 18%.
What stood out about this decline was WTI’s return to below $80 a barrel by Friday’s close. Technical analysts say the U.S. crude benchmark still has a gap that needs to be filled between its March 31 settlement of $75.67 and the April 3 open of $80.10. That means WTI could drop to mid-$70 in the coming week, which could be another bearish week for oil before the U.S. Federal Reserve's rate decision on May 3.
If WTI gets to $75 or below, Brent, which trades at a $5 premium to the U.S. benchmark, risks dipping beneath the $80 mark too. This could again raise the ire of OPEC+. But is it all of OPEC+ that we need to be concerned about? Or is it just one name within the alliance?
Let's examine, beginning with Russia. The truth is Russia really doesn’t need to sell oil at $80 a barrel or more. Sure, the G7’s $60 per barrel cap on Urals crude is annoying to Vladimir Putin — both from a sovereign point and the negative impact it has in funding the Russian president's occupation of Ukraine.
Even so, with the G7, the powers within the Kremlin are realistic about what they’re up against: an entire global network of oil shippers, tanker insurers, issuers of letters of credit (i.e. banks) and other service providers who have no choice but to follow the dictates of the U.S. Treasury, or be sanctioned themselves.
As such, Moscow is content to supply as many barrels as necessary to willing customers (read: Indians and Chinese) at prices that work for both buyer/seller. And until a month ago at least, those prices were at or below the G7 cap.
The price Russia has paid on the West’s sanctions is, however, debatable.
According to Russian government data, revenue from oil and gas rose by 28%, or 2,500 billion rubles, in 2022. Converted, that comes to a neat $36.7 billion. Arguably, that spike was the result of the net increase in crude prices before the G7 price cap came into force in December last year. Global benchmark Brent went from just over $77 a barrel in December 2021 to a 14-year high above $139 in March 2022, right after the Ukraine invasion. After a selloff in the third quarter triggered by softer demand and growth worry, Brent finished last year at under $86.
Notwithstanding the G7 price cap, the West’s actions against Russia turned out to be manna from heaven for Indian oil importers and refiners, who imported record numbers of barrels from Russia at fire-sale prices, rebranded them as Indian oil and resold them at a premium.
The buyers included some of the same G7 nations, which knew only too well what was going on. It was what Washington desired anyway: The world should not be deprived of Russian oil, which is critical to a market already squeezed by OPEC cuts and other production outages. Also, the Biden administration’s aim was to throttle funding for Putin’s war in Ukraine and the price cap appears to have started doing that, the White House said.
So, price elasticity in oil is something that not just Russia but most countries within the OPEC+ alliance have learned to accept, even if they grumble about budget shortfalls from oil revenue.
Four of the Arab region’s most prolific oil producers, from second largest Iraq to the other three in respective order — the United Arab Emirates, Kuwait and Iran — have all learned to adjust and tighten their belts when needed; except for one: Saudi Arabia.
At a time the world economy is contracting, Saudi Crown Prince Mohamed bin Salman — often cryptically referred to by his initials MbS — is plunging $7 trillion into a redevelopment plan to diversify Saudi Arabia away from its oil economy. Called Vision 2030 and centered around a futuristic work-play-and-live hub called Neom, the seemingly noble plan mooted five years ago is today high in grandiosity and low on delivery. And MbS expects the rest of the world to pay for that through the Saudi hegemony of OPEC+.
The main reason OPEC+ went down the path of a second production cut announcement in four months — the first to reduce 2.0 million barrels per day was made only in November before another to take off another 1.7 million daily came in April— was to fulfill the Saudi need for $80 or more oil, which some say is critical to finance Neom, regardless what happens to the world economy.
To hear the Wall Street Journal put it, MbS “is in the midst of a plan to use his country’s gusher of oil revenue to transform its economy, rework its landscape and upend its conservative culture.” The report adds: “As prices hit $100 a barrel last year, the kingdom accelerated plans for its so-called giga-projects, which include a new city in the desert, as well as Red Sea resorts and a built-from-scratch tourism industry.”
Saudi Energy Minister Abdulaziz bin Salman — MbS’ half brother — had promised last year to act quickly if he saw the oil market turning in the wrong direction. The back-to-back announcement of production cuts totaling 3.7 million barrels per day was apparently to fix that “wrong”, when one can argue the market was acting rightly given the concerns of demand in a recession.
“OPEC+ pre-emptive action may have been taken on accurate assumptions [that] the economy and demand … will not propel the price back above $100,” Craig Erlam, analyst at online trading platform OANDA, said on Friday.
According to OPEC+, seven of the 23 nations in the alliance — about a third of the group — will contribute to the new cuts, negotiated primarily between the Saudis and Russians to get ahead of a global slowdown. Russia, on its part, said it will extend till the end of the year the 500,000 barrels per day of cuts it pledged in March. The Saudis pledged an additional 500,000 barrels daily on top of what they claimed they were already cutting, with UAE promising 144,000, Kuwait 128,000, Oman 40,000 and Algeria 48,000. Kazakhstan — already in the news at that time over an exports blockade — pledged 78,000 barrels.
The Wall Street Journal also said Saudi Arabia wants higher crude prices to help “replenish Russia’s reserves”. That, of course, is utter fertilizer. Russian oil reserves don’t need Saudi bolstering. As the world’s biggest oil exporter, the Saudis have benefited even more from the Ukraine war than India. They, of course, did their bit for Russia too with their declaration that OPEC was apolitical and, therefore, could not condemn or would not act against Moscow over the invasion — an interesting position given that oil itself is the most politicized commodity.
The real problem with OPEC+’s production cuts — I call them maneuvers — is that like the Neom project, they are high on promise and low on stats. The original OPEC group, through most of its six decades, had a history of over-pledging and under-delivering on cuts. While the alliance achieved over-compliance on promised cuts in the aftermath of the 2020 coronavirus breakout, experts say that was more a result of battered demand that led to minimal production, rather than a will to cut barrels as pledged.
What OPEC+ is doing is using the power of the megaphone: Announce a cut, get a huge positive impact on prices, then produce what it really wants.
And if one thinks it through, it’s really quite simple to understand the OPEC+ mindset: No producer will turn away a buyer who wants more oil because the buyer will simply go to another source. With demand back at 2019 levels, almost every producer has been maxing output while publicly proclaiming adherence to production cuts.
By June though, global summer for oil is expected to accelerate, with or without production cuts. OPEC+ will simply raise output then, probably without any drama, while giving the appearance that it was still cutting the millions of barrels per day that it had pledged.
Should crude prices still totter at $70 levels or below at that time over recession worries, we know what the Saudis will do as the June 3 OPEC+ meeting approaches. The reality is MbS might not even wait till then — ordering his half-brother to take any arbitrary decision that can be dressed up later as a consensus — to push the market higher.
Oil: Market Settlements and Activity
New York-traded West Texas Intermediate for June delivery settled at $77.87 — up 50 cents, or 0.6%, on the day — as per CME data. For the week, June WTI was down 5.6% from the April 14 settlement of $82.52 for the front month contract.
On Investing.com, WTI for June delivery showed a final post-settlement trade of $77.95, as per capital.com data.
June Brent officially settled Friday’s trade at $81.66 — up 56 cents, or 0.7% — as per CME data. For the week, the global crude benchmark fell 5.4%.
London-traded Brent for June delivery showed a final trade of $81.75 per barrel on Investing.com in data published by capital.com.
Oil: Price Outlook
If oil bears attempt to force WTI to fill its April 3 gap of $75.67, Friday’s settlement of $77.87 for the June contract will first be dragged down to $77 and then be set up for a retest of the $75.80 support, said Sunil Kumar Dixit, chief technical strategist at SKCharting.com.
“After four weeks of strong positive action, WTI has fallen almost 6% for the first time in a week,” Dixit noted. “The weekly stochastics at 69/84 makes a negative overlap while RSI at 48 is positioned below neutrality of 50.”
“Major downside potential is seen at $73.80,” he added.
On the flip side, he said June WTI could move back towards $79.50, above which the 200-Day Simple Moving Average of $82.40 remains a strong resistance.”
Gold: Market Settlements and Activity
The most-active June gold futures contract on New York’s Comex settled Friday’s trade down $28.60, or 1.4%, at $1,990.50. The session bottom for June gold was $1,982.35. Since its run to a more than three year high of $2,048.60 on April 13, Comex’s most-active gold contract has lost almost 3%. For the current week, it was down 0.6%, after last week’s slide of 0.5%.
On Investing.com, gold for June delivery showed a final post-settlement trade of $1,994.10, as per capital.com data.
The spot price of gold, which reflects physical trades in bullion and is more closely followed than futures by some traders, settled down $21.17, or 1.1%, at $1,983.64. For the week, it was also down 1%.
The latest weekly decline in gold began after the Dollar Index and U.S. Treasury yields rebounded from the one-year lows hit last week. Gold is a direct contrarian trade to the dollar. Besides that, a higher dollar tends to weigh on overseas demand for commodities priced in the currency. Higher Treasury yields also sap the appeal of risk-heavy assets, while also limiting flows of foreign capital into the United States.
A relatively softer dollar in the past 24 hours, however, did not help gold.
Still, weighing on gold were concerns that the Federal Reserve will agree on another quarter point increase at its May 3rd rate decision which will bring U.S. interest rates to a peak of 5.25% — versus the pandemic-era rate of just 0.25%.
“Gold remains choppy as we near the end of the week,” said OANDA's analyst Erlam. “Uncertainty over the path of interest rates, which should become much clearer over the next month or two, is driving the indecision we're seeing in gold at the moment.”
While Erlam noted that higher Treasury yields had stalled the rally in the yellow metal, “traders are clearly in no mood to give up on the yellow metal.”
“As things stand, dips are being bought and it will be interesting to see if we see the same on this occasion as well,” he added. “Big support remains around $1,940-$1,960.”
Gold: Price Outlook
Dixit of SKCharting said an upward rebound in gold will require a strong breakout above the 5-Day Exponential Moving Average, or EMA, of $1,996 and a horizontal resistance zone of $2,015 to retest the swing high of $2,048.
“Going forward into the week ahead, if the Dollar Index breaks and sustains above $109.95, we are likely to witness the dollar gaining further upside towards the weekly Middle Bollinger Band of $103.10, followed by the 50-week EMA of $103.65,” said Dixit. “This may push gold lower towards the Fibonacci level of $1,955. In the event of any extended weakness, gold could even get to the 50-day EMA of $1,943.”
Natural Gas: Market Settlements and Activity
Natural gas bulls aren’t making much progress beyond the mid $2 level, but a second weekly win of 5% might assure those long on America’s favorite fuel for indoor temperature control that a price breakout could be imminent.
The most-active May gas contract on the New York Mercantile Exchange’s Henry Hub settled down 1.6 cents, or 0.7%, at $2.221 per mmBtu, or metric million British thermal units. For the week though, May gas was up 5.1%, mirroring last week’s run-up.
On Investing.com, gas for delivery in May shows a final post-settlement trade of $2.22, as per capital.com data.
The debate on when the bearish tide would irrevocably turn for ‘natty’ — as the all-season fuel for indoor heating and cooling is known — has raged since gas prices began their headlong fall from 14-year highs of $10 in August to crash to 2-1/2 year lows beneath $2.
At brief intervals over the past two months, the market had appeared to be on the cusp of a serious rebound — like in late February when it got above $3 after breaking below $2 earlier that month for the first time since September 2020.
This week, again, such a phenomenon appeared when the front-month May gas contract rallied to almost $2.40 — a level it had not reached since late March — exciting traders and analysts over the prospect of $3 pricing and beyond.
Friday’s slide in gas prices came as investor focus returned to the abysmal state of U.S. gas inventories held in storage, after one of the warmest winters on record.
Gas storage for the week ended April 14 rose by 75 billion cubic feet, or bcf, after all the burning done for power generation as well as for heating as some unexpected chill for this time of the year surfaced, the Energy Information Administration, or EIA, reported.
That 75-bcf injection bumped up total gas inventories to 1.930 trillion cubic feet, or tcf, EIA records showed. At current levels, the gas storage stands at 34% above the year-ago level of 1.442 tcf and nearly 21% higher than the five-year average of 1.601 tcf.
In the short term, Henry Hub prices could continue to recover in the higher $2 trajectory, said analysts at Houston-based energy markets advisory Gelber & Associates.
“Weather forecasts from major weather models still show a cold front coming through in the coming days, leading to colder than average end of April and beginning of May,” Gelber’s analysts said in a note issued on Friday to the firm’s natural gas clients. “This cold front is expected to increase weather-driven demand to high levels.”
But the mid-term outlook remained cloudy, the note said.
“Overall, the market still has way too much supply for these small weather runs to significantly affect the supply/demand balance,” Gelber’s analysts added.
Natural gas: Price Outlook
In what seems to be a flattening bottom which is still too early to be confirmed, natural gas futures closed above the 5-week EMA for a second time, noted Dixit of SKCharting.
“If breakout from the descending channel withstands bearish pressure, clearing through the 50-day EMA dynamically positioned at $2.52 will be an immediate challenge,” he said. “This may extend the upward move towards swing high to $3.03.”
A break below the daily Middle Bollinger Band of $2.15 may begin some decline towards the small gap left at $2.11 and extend that towards $2.04, Dixit added.
Disclaimer: Barani Krishnan does not hold positions in the commodities and securities he writes about.