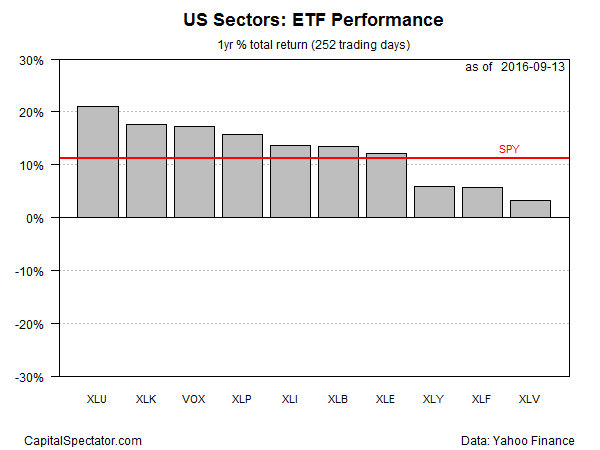
US equities had another rough day yesterday, but the market’s momentum profile via sectors has firmed up lately by way of one-year changes. In contrast with recent history, annual returns for sector funds have turned uniformly positive via a set of proxy ETFs. Even the battered energy group is now sitting on a respectable year-over-year increase.
One thing that hasn’t changed: utility stocks continue to hold the lead among the major sectors. Supported by expectations that interest rates will remain lower for longer, the yield-sensitive Utilities Select Sector SPDR ETF (NYSE:XLU) is ahead by more than 21% in total return terms for the year through yesterday (Sep. 13). In close pursuit is the Technology Select Sector SPDR ETF (NYSE:XLK), which is up over 17% in year-over-year terms.
At the tail end of the horse race is the Health Care Select Sector SPDR ETF (NYSE:XLV). Although the sector is in the black at the moment, the slim 3% annual gain may be a reflection of rising political risk. As CNBC noted last week,
Health care has been slammed by political headwinds, largely the result of Democrat Hillary Clinton’s assault on drug pricing during the presidential campaign. But both major party candidates could rock the sector from the White House, as Republican Donald Trump has also criticized pricing for Medicare drugs and has said he would dismantle the Affordable Care Act.
Meantime, the market overall is still holding on to a solid year-over-year gain. Although the S&P 500 has tumbled from its recent highs, the annual change for the benchmark remains solidly in the black through yesterday’s close. Indeed, the SPDR S&P 500 ETF (NYSE:SPY) is currently posting a 10.8% total return.

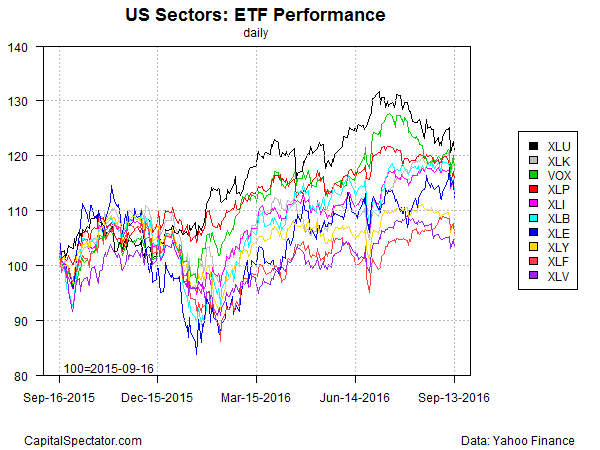
But while all the sectors are in positive territory for the trailing one-year period, the upside bias looks a bit wobbly when we review the performance indexes. As the chart below shows, the strong bullish momentum that had been in force through July is now looking a bit tired.

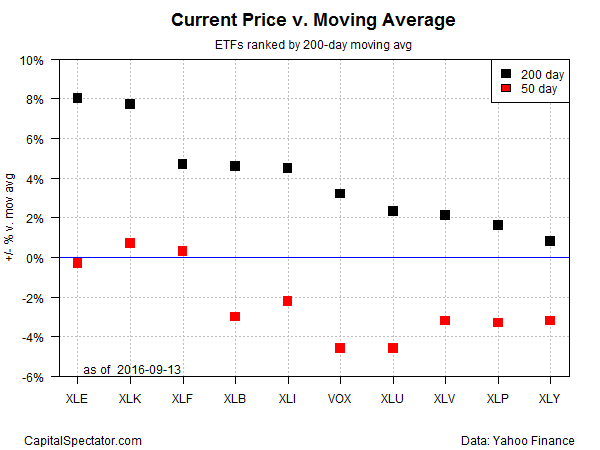
Ranking the sector ETFs based on moving averages reflects a mixed picture. Although all the funds are currently trading well above their 200-day averages, all but two ETFs have recently slipped below their 50-day averages. In other words, the summer’s bullish momentum is looking a bit tarnished as we approach the start of autumn.

