Updated XRP/USD forecast: Ripple key levels and the Ripple future price moves.In this post I applied the following tools:
fundamental analysis, all-round market view, candlestick patterns, volume profile, oscillators and indicators, key levels, trendline analysis, Renko Kagi chart, Line Break chart, Tic-Tac-Toe chart.
Today, I’d like to go on my series of crypto forecasts with the Ripple analysis and revise the trading scenario to trade XRP/USD.
First, let’s compare the forecast and the Ripple actual scenario, as usual.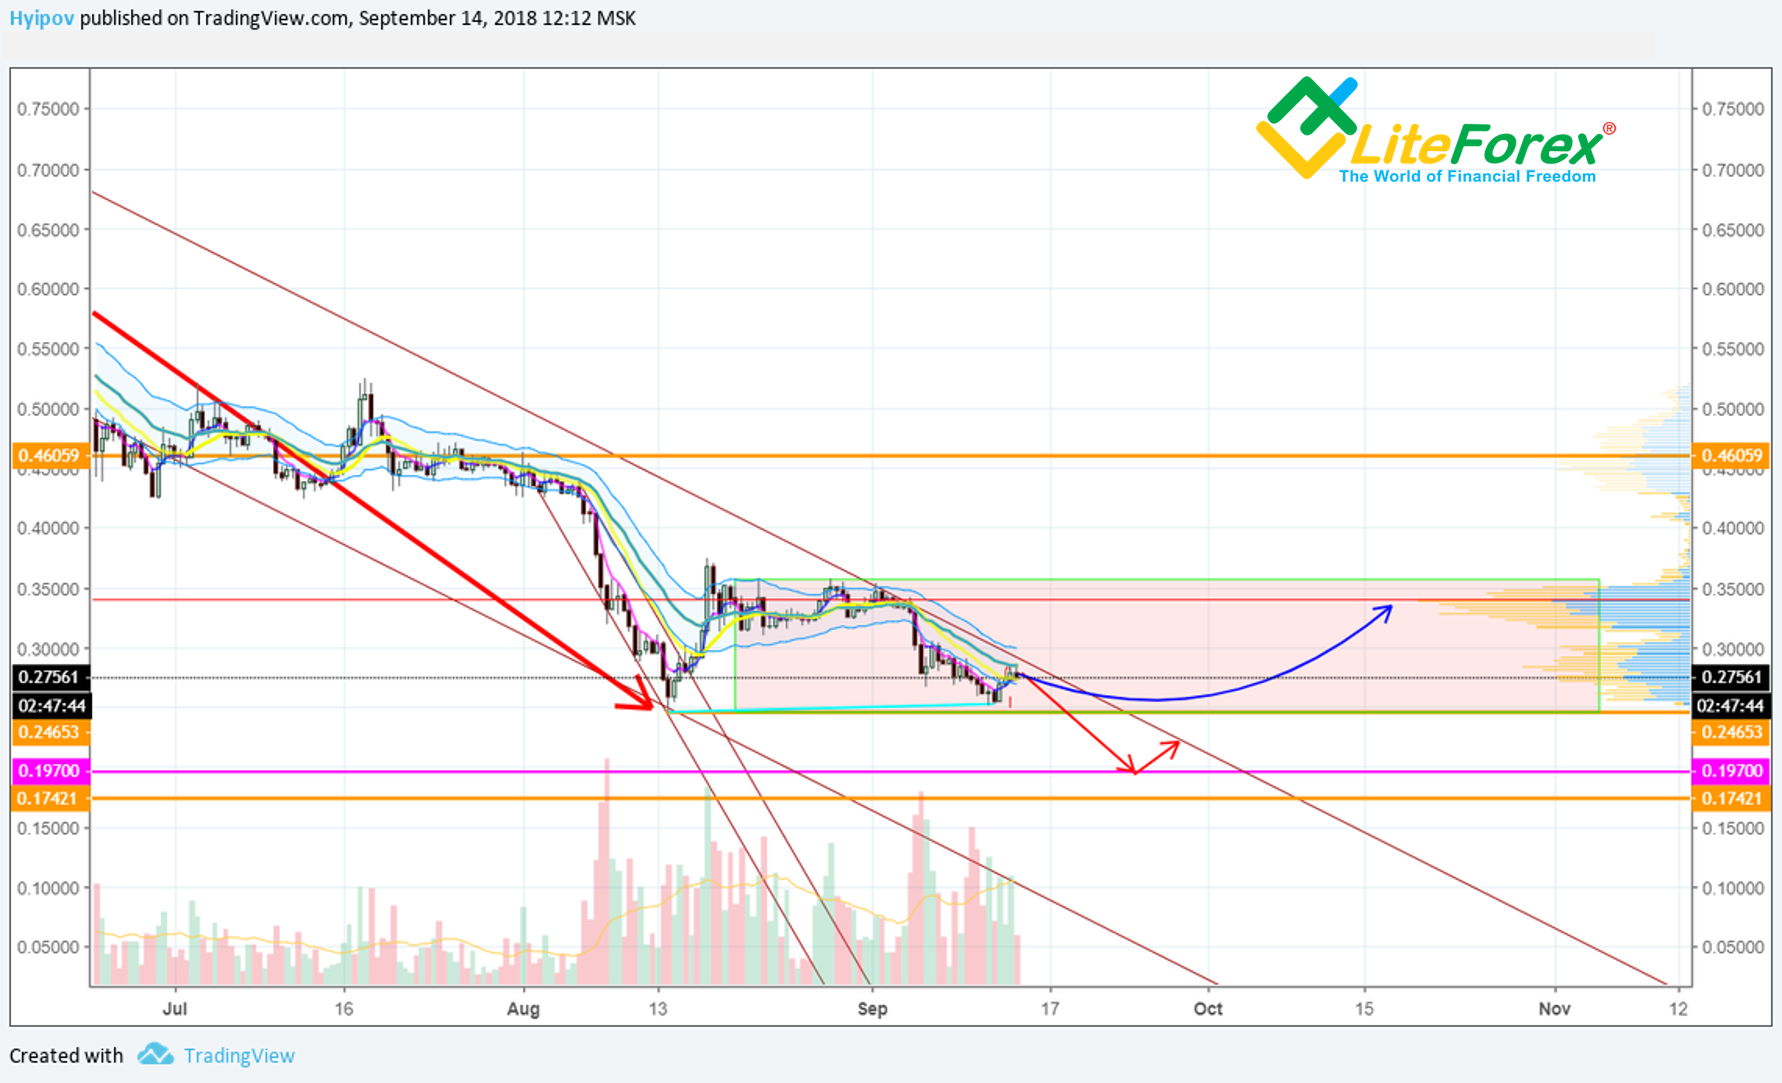
XRPUSD forecast dated, 14.09.2017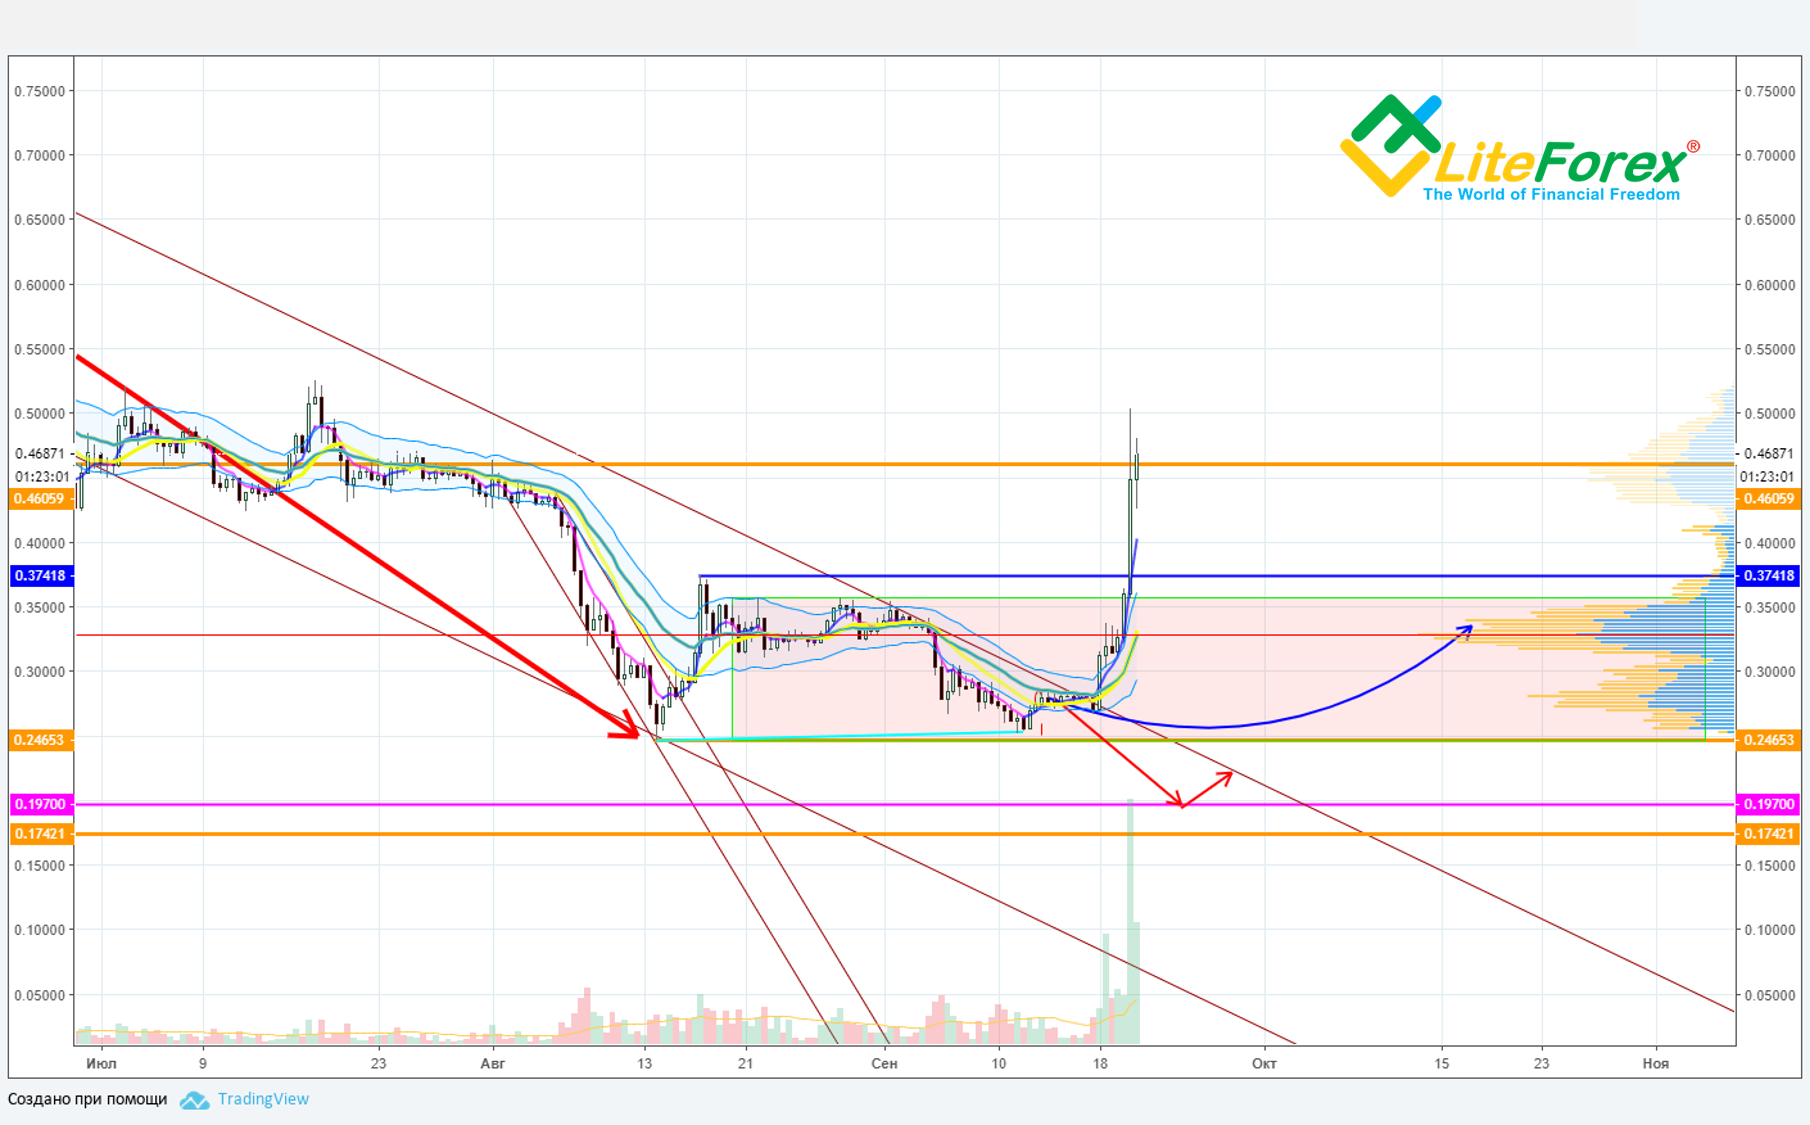
XRPUSD actual state on 21.09.2017
In my previous analysis for Ripple, I suggested that it found its bottom and was likely to trade in the sideways trend.
Actually, XRP trend turned out far more optimistic than I had expected.
I’ll try to find out what the reason was for such a strong upward momentum.
XRP/USD Fundamental Analysis
According to the fundamental analysis of Ripple, there has been one very important event.
Sagar Sarbhai, the head of Ripple Labs regulatory relations for Asia-Pacific and the Middle East, stated that he believed xRipple final launch to occur about the next one month or so. It will, in fact, serve as a payment provider between the banks and all its partners.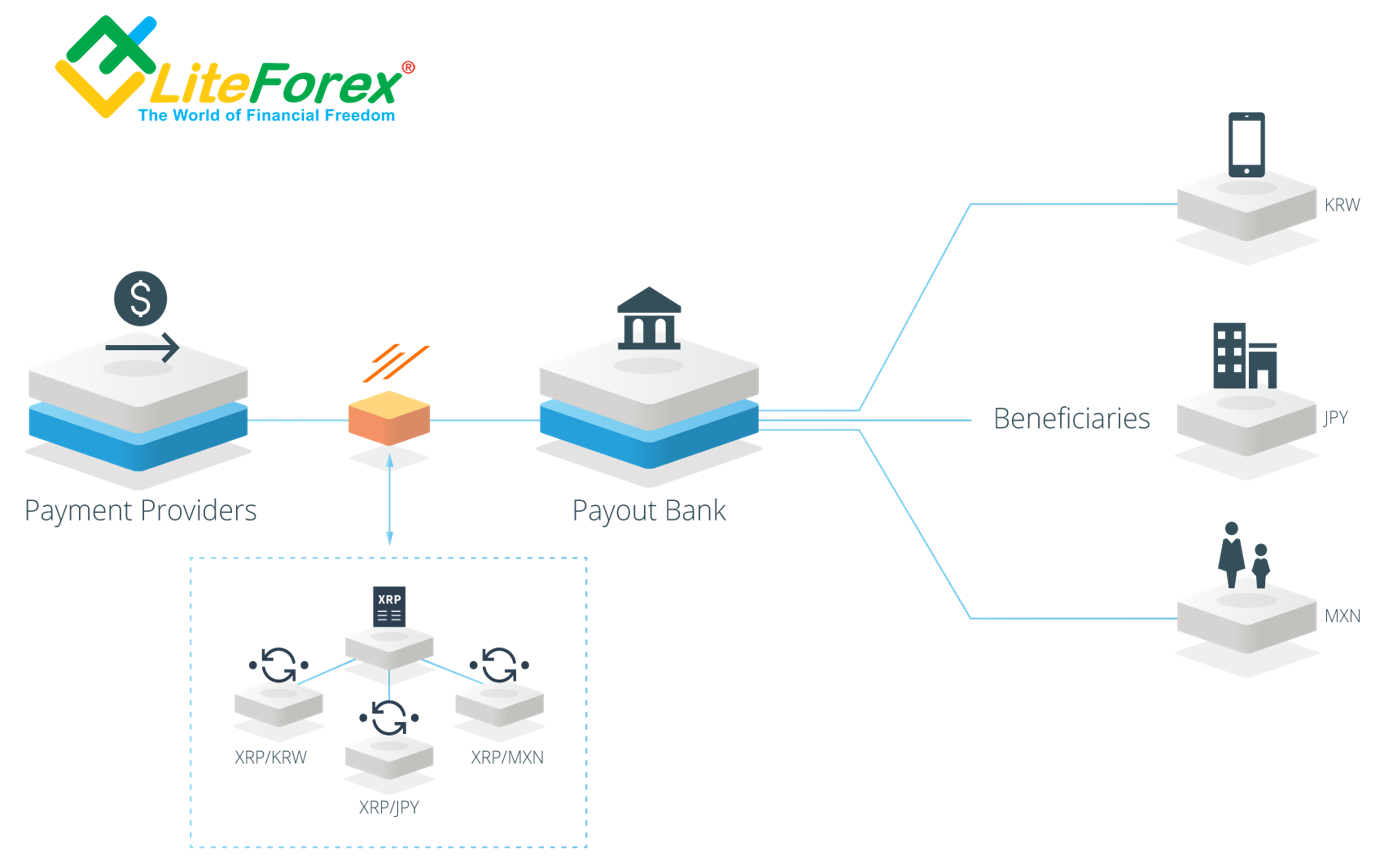
However, I want to note that this network is closed and XRP will be actually used as SWIFT in the system of transfers between the network participants to support the liquidity of the funds sent. Besides, the Ripple itself won’t be withdrawn from the system, it will gust serve as a single unite of measurement of the funds, transferred between the sender and the receiver.
It must note that there is already xCurrent that serves a simplified version of xRipple, working as the inter-bank messaging system.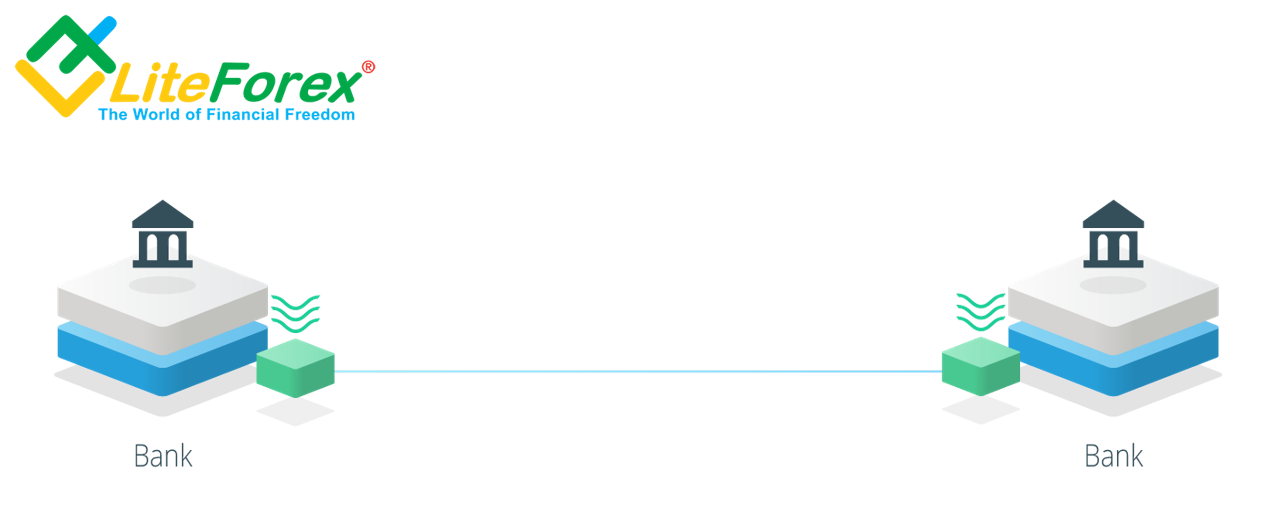
I can highlight two facts here:
- Sarbhai hasn’t named the exact timelines, having outlined very approximate terms. xRipple launch has been discussed for quite a long time, it has been tested since Spring; therefore, I don’t understand such strong market response to the information.
- The xRipple payment system alone doesn’t provide a higher price for the token itself. It will operating in a closed network, that is XRP won’t be used as a payment means. It is needed only to support the transfers inside the network. A good example of such closed system is xCurrent. It has been operating for a long time already, and the token price wasn’t somehow affected by this fact.
- About this program testing has been known for a long time. The crypto media mentioned the results of xRipple as early as in May.
Finally, I can add to my Ripple fundamental analysis that XRP rise, we have been witnessed for the past few days, is just a crypto market manipulation. There haven’t been any sensations; but the Ripple community members seem to be so desperate about good XRP price that the expectation of its rise just drove them mad. The manipulators are, naturally, fueling the situation even more, encouraging the panic buys.
XRP/USD Technical Analysis
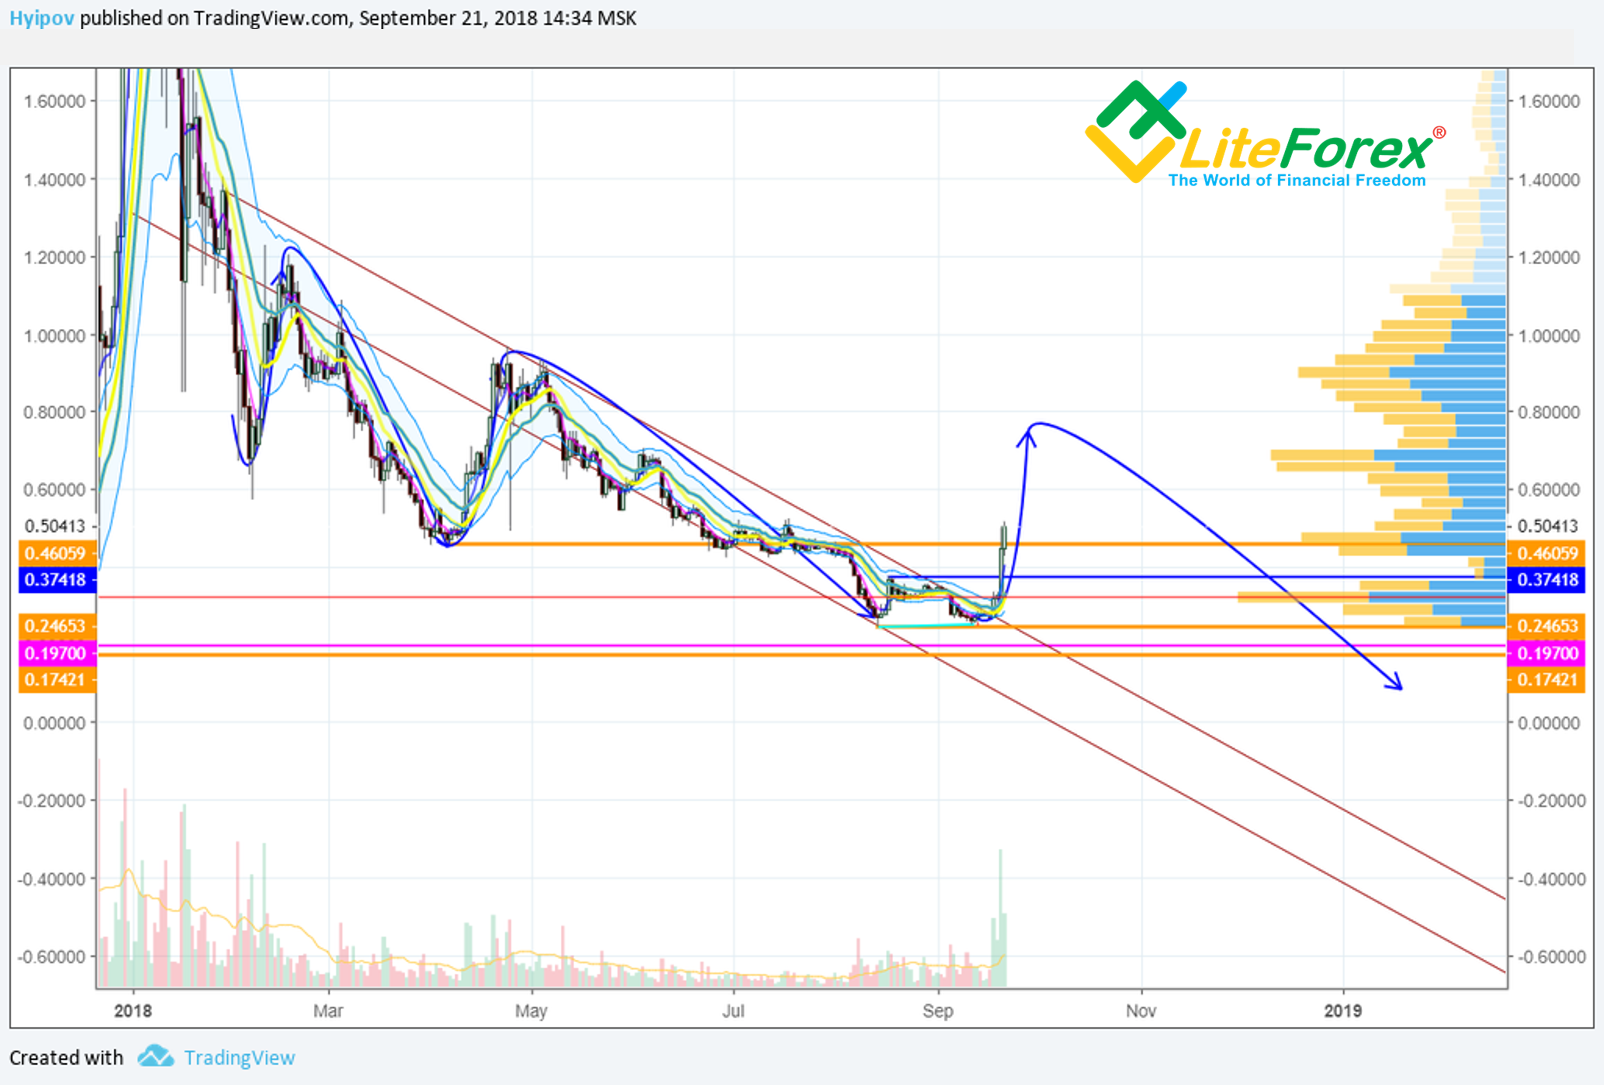
As it is clear from the Ripple chart, the current situation have repeated many times. According to the Ripple history, its entire price chart consists of only pumps and dumps. You see in the chart of Ripple above, there are clear two similar cycles, which always ended at the growth start.
Projecting the recent momentum, I can assume that its border can be at about 0.75 USD. To be more precise, I’ll carry out all-round market view.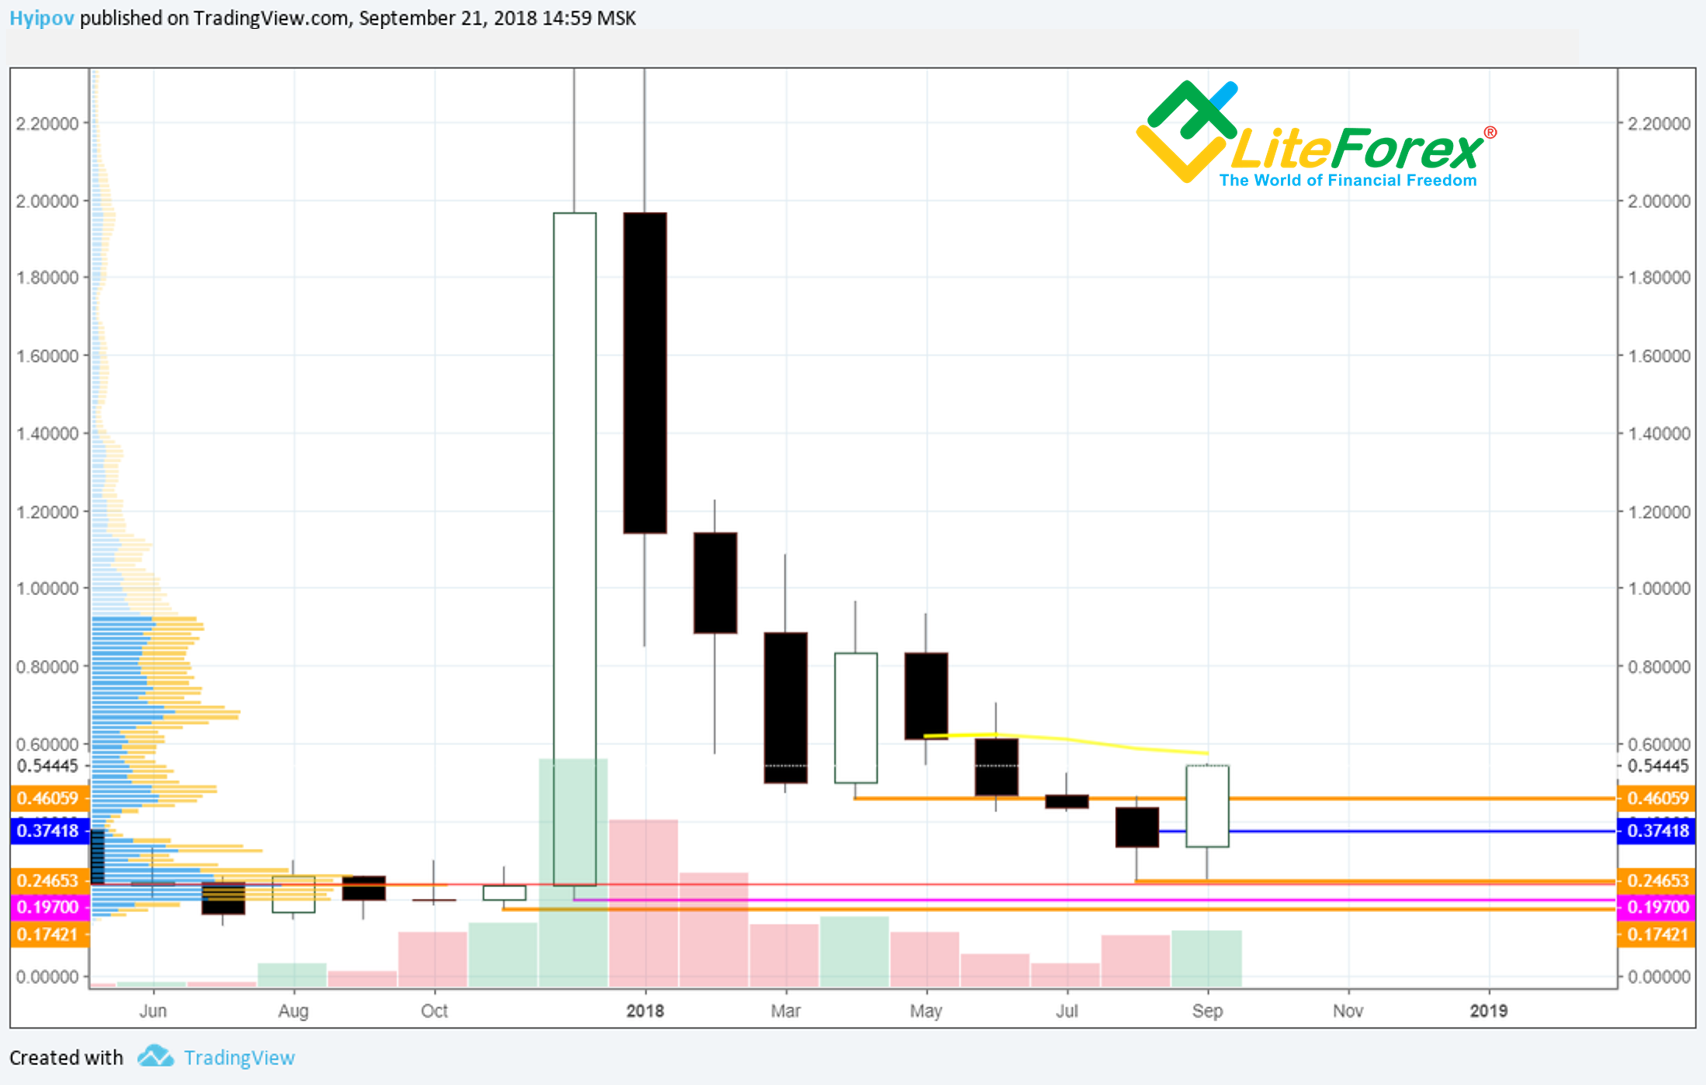
It is clear in the XRP/USD monthly chart above tha the last candlestick has completely covered two previous bearish candlesticks, breaking through the strong resistance level at 0.46 USD. If the Ripple price stands at these levels at least, it will be a strong bullish signal to go up higher.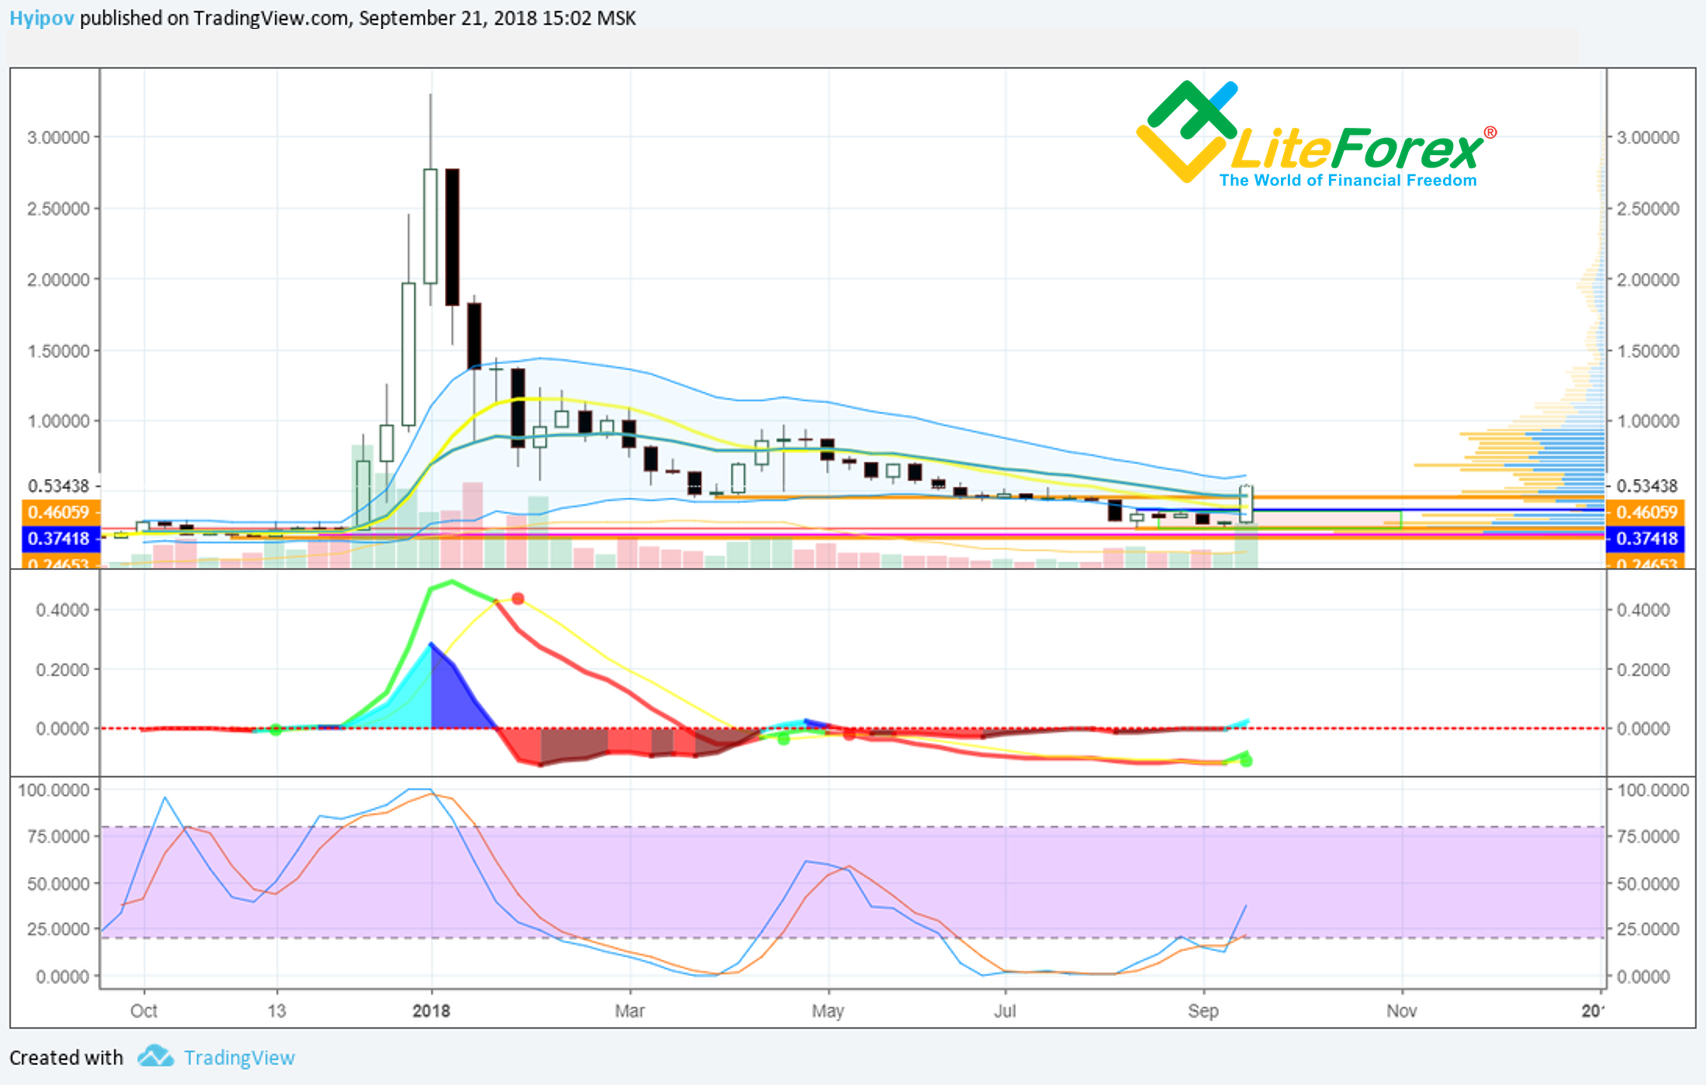
In the weekly chart of XRP, MACD is already sending a growth signal. RSI suggests the same, it is gradually exiting the oversold zone.
Keltner channel’s top border in the weekly chart is marked at 0.61 USD. If the XRP/USD pair goes beyond this level, it will mean it is strongly overbought, creating a certain resistance to Ripple bulls.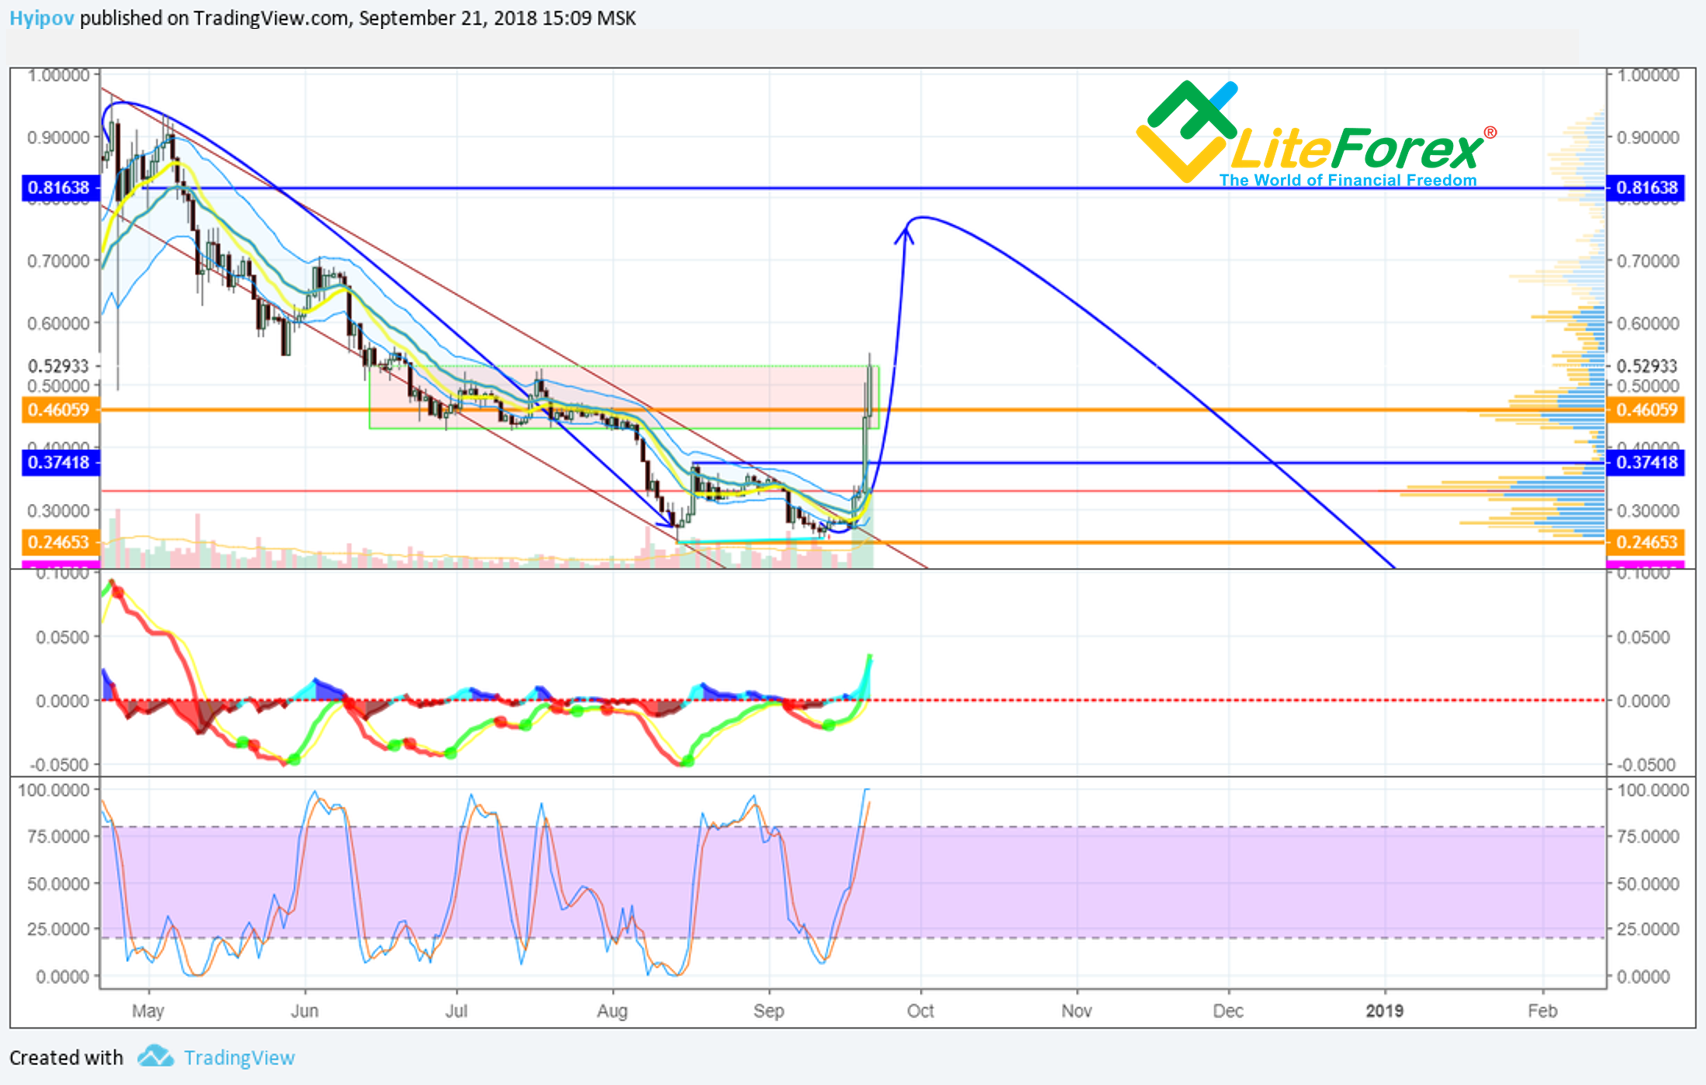
In the XRP/USD daily chart, you see that XRP/USD ticker is trying to exit trading channel. RSI stochastic has already entered the overbought zone and hit the top border. MACD indicates some room for growth in these terms. Nevertheless, Ripple will hardly go up continuously day after day. The ticker has already passed a half of its potential movement, so I may assume that the manipulators will use the trading channel for accumulating more positions.
And finally, let’s have a look at the experimental charts.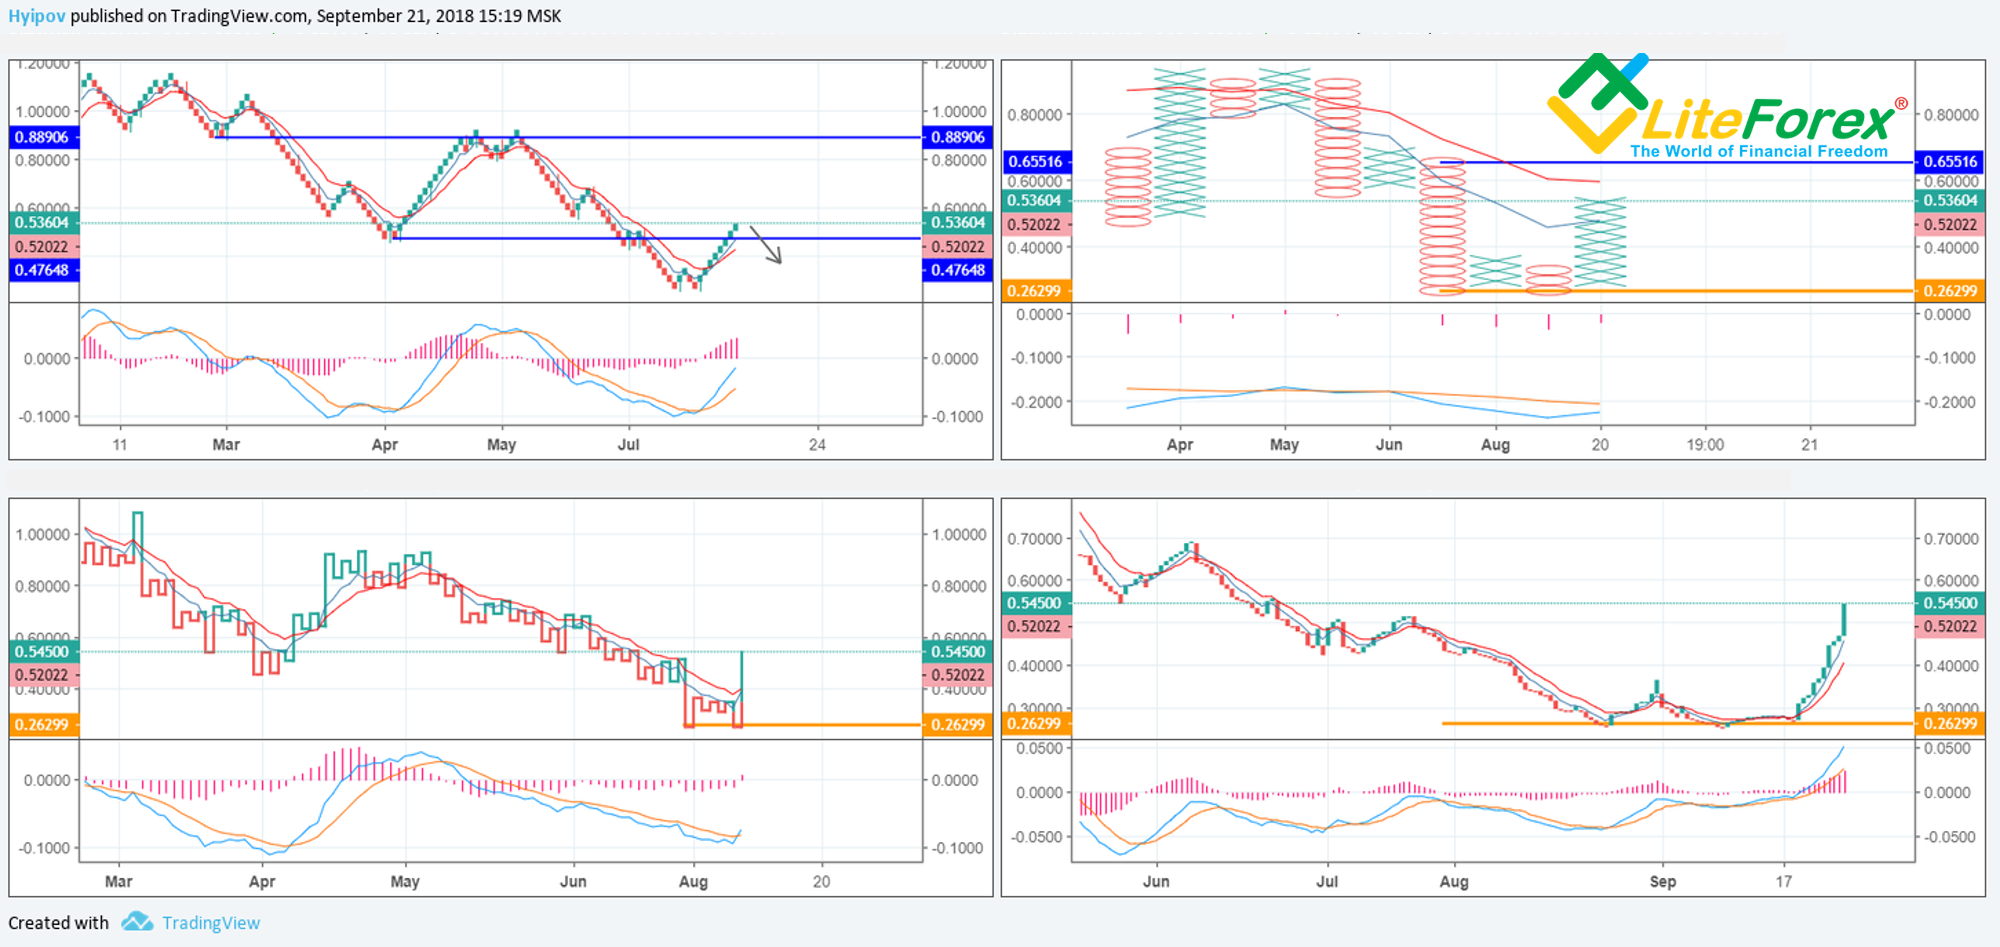
As I have expected, all charts are indicating growth. THE most informative in this situation are Renko and Tic-Tac-Toe charts.
It is clear in the Renko chart that the growth wave doesn’t usually pass through the key resistance levels of the previous base. In this case, the ticker has reached this point, and so it needs the price correction to go up higher.
The Tic-Tac-Toe charts confirms this idea. It is very seldom when the growth wave covers the previous bearish wave at the first try. Moreover, on column is not usually longer than 10 units, and so, the current up-wave has only two Xs ahead, or, in dollar terms, it is about 0.06 USD more.
Up-To-Date XRP/USD Forecast
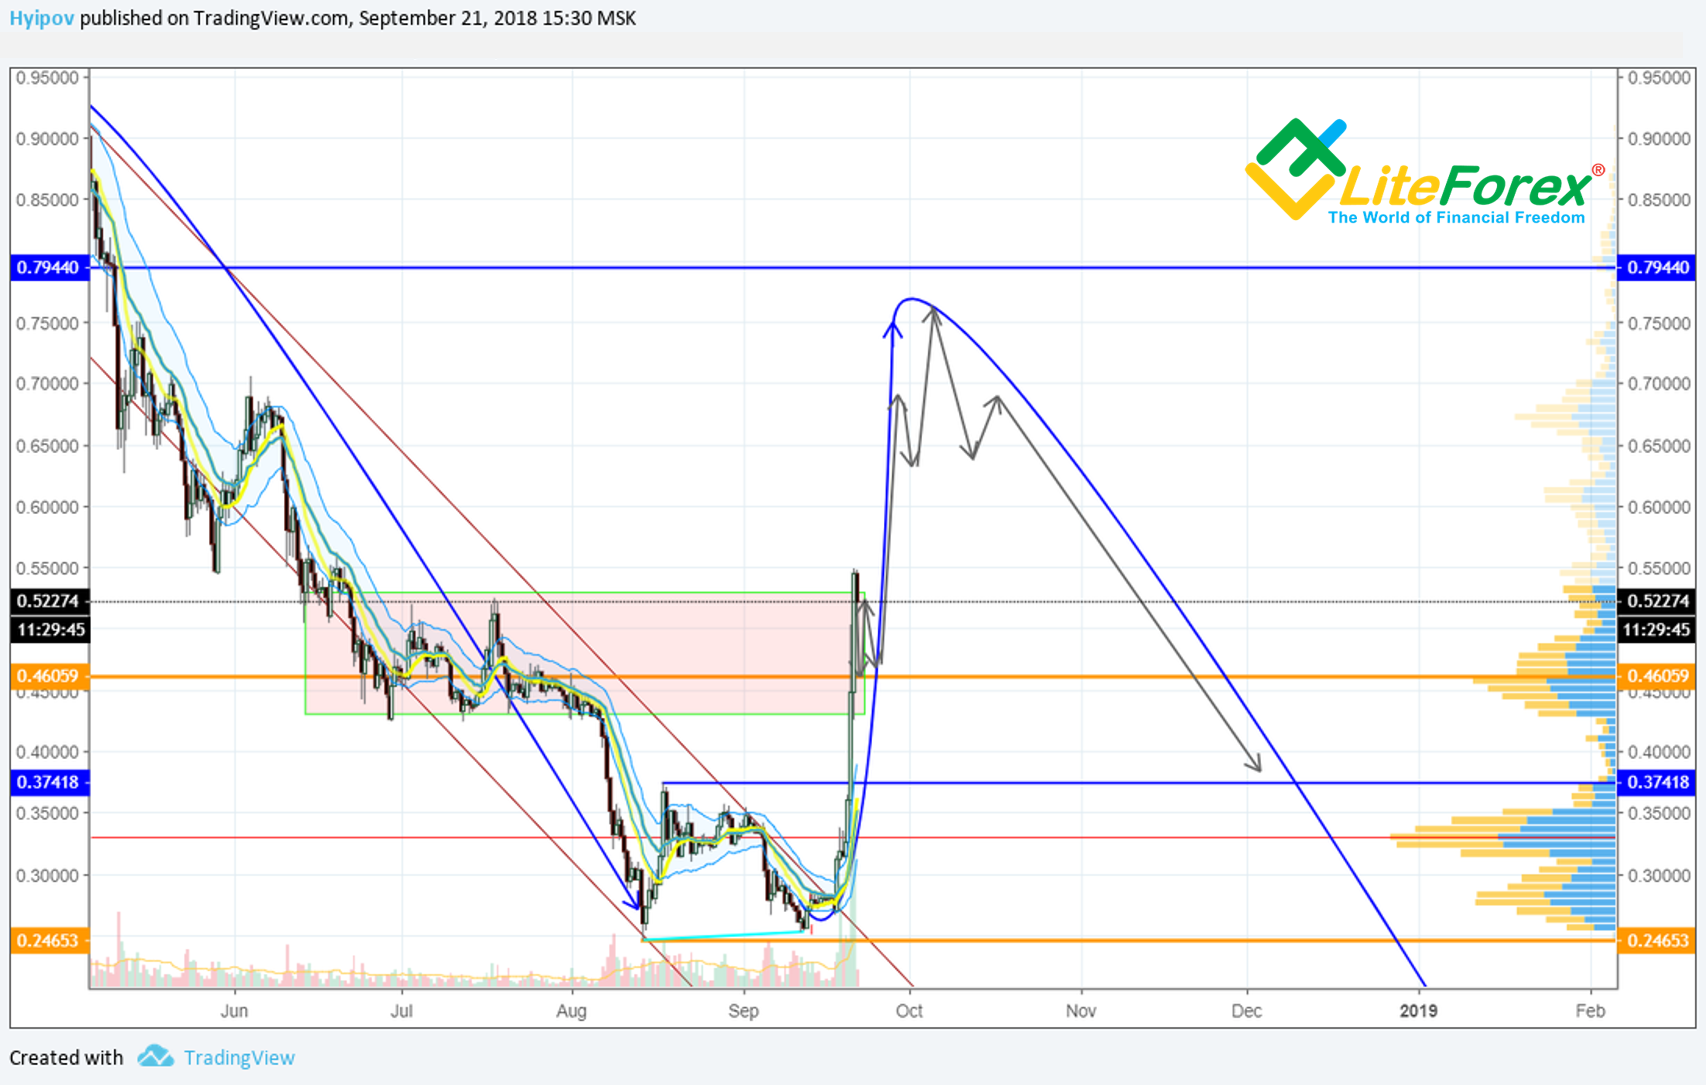
The recent XRP rise is not natural, obviously. It just shows manipulations, so as common crypto traders say “a trader expects, but a manipulator determines”.
It is a joke, but there is some sense, in fact! Investors can do nothing but guess up to which level this crazy pump will go on. If you draw a parallel with the previous momentum, the current up-move should be limited at 0.75 USD (the local low of the recent rise, the border of the traded channel). The XRP ticker can easily slide down from that level, as it has occurred many times; Ripple, in fact, hasn’t changed its features fundamentally. It used to be a centralized coin, and it still is; so, I wouldn’t invest in Ripple in the long-run, though the short-term pumps look rather appealing.
To participate in the pump, the easiest way is to enter a trade at the channel’s bottom border, at about 0.45, with a stop below 0.42 and the target profit at about 0.75.
That is my price forecast for XRP/USD pair for the near future. Go on following the Ripple rate and staying informed on the cryptocurrencies and digital assets.
Which stock should you buy in your very next trade?
AI computing powers are changing the stock market. Investing.com's ProPicks AI includes 6 winning stock portfolios chosen by our advanced AI. In 2024 alone, ProPicks AI identified 2 stocks that surged over 150%, 4 additional stocks that leaped over 30%, and 3 more that climbed over 25%. Which stock will be the next to soar?
Unlock ProPicks AI
