
XRP is a cryptocurrency developed by Ripple Labs, Inc.
When initially released in 2012, XRP was known as “OpenCoin.” In 2015, the name was changed to Ripple. XRP is still often referred to as Ripple despite a second name change in 2018.
The purpose of XRP is to be used by banks and payments providers to source liquidity for settling international payments.
In this article, we assess the strengths and weaknesses of XRP and Ripple in our fundamental analysis. Then we perform a technical analysis over XRP. This allows us to define possible patterns and predict possible prices in 2019, 2020, and beyond!
First, we begin with a summary of our most recent analysis of XRP:
Regular Price Predictions for XRP (XRP)
At BeInCrypto, we offer regular price analyses and predictions of the most popular and relevant cryptoassets. We completed a March analysis of Bitcoin’s price predictions which can be found here. In addition, we predicted prices throughout April here. Below is a summary of our most recent short-term price analysis and predictions for Bitcoin published on Apr 11, 2019.
On Apr 5, XRP reached a high above $0.38. A gradual decrease ensued, which intensified on Apr 10.
At the time of writing, the price of XRP was trading close to the support area at $0.32.
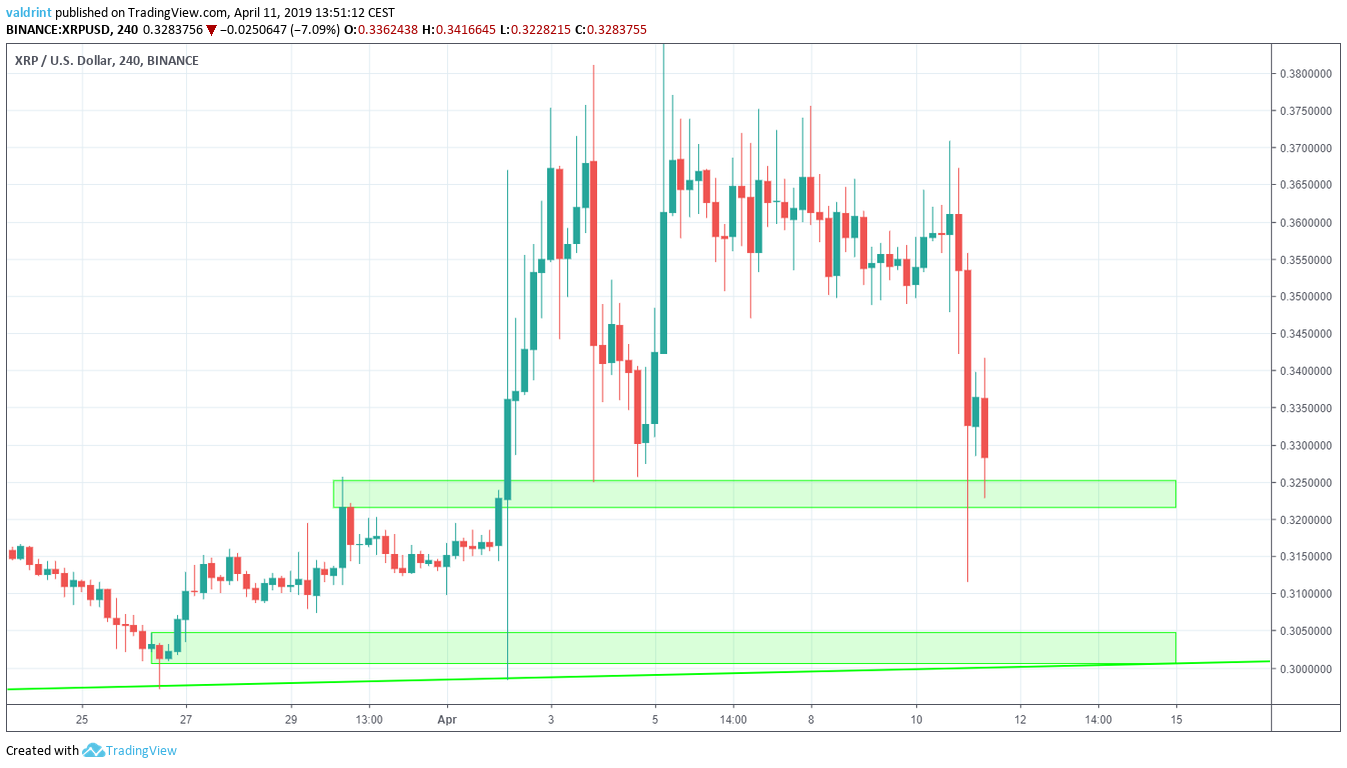
In our latest analysis completed on Apr 11, we predicted further decreases for XRP. While short-term increases are possible, we believe that the price will eventually reach $0.30.
Fundamental Analysis
From a fundamental perspective, Ripple (XRP) is still one of the most exciting competitors at the top of the cryptocurrency market. XRP boasts fast transactions and speeds, ease of use, and a unique consensus protocol.
Coinbase Listing and Emerging Controversy
XRP was recently listed on Coinbase Pro, with trading pairs against BTC, USD, and EUR. The listing thus far has had a very limited effect on the price. In the preceding days, the so-called “XRP Army” was responding to various accusations from all directions.
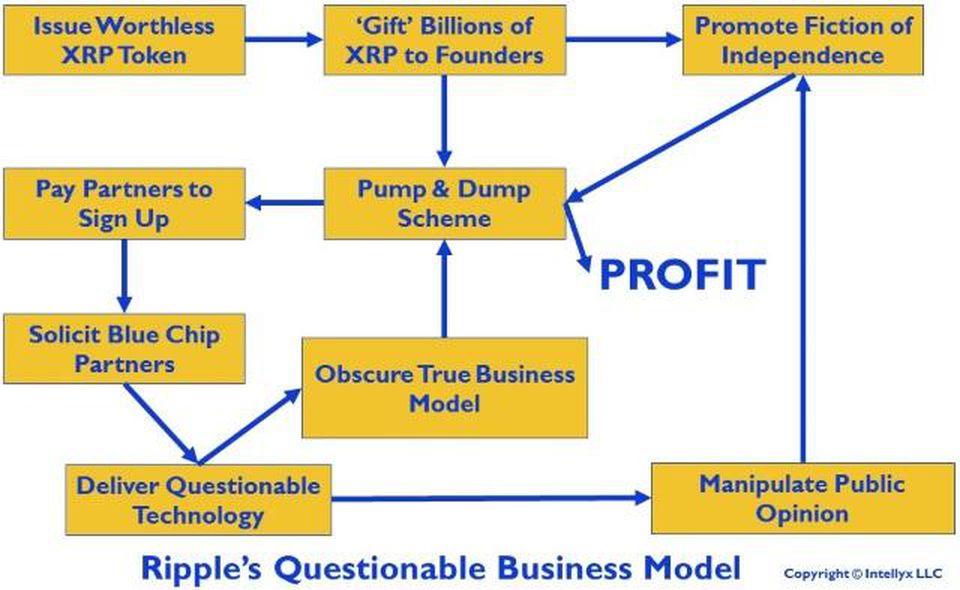
Questions and accusations of insider trading emerged. Furthermore, on Mar 1, an article by Jason Bloomberg in Forbes reported:
“The Ripple business model is a giant pump and dump scheme…[that] takes numerous steps to obscure this basic fact.”
With accusations of insider trading and allegations of pump and dump schemes now looming, Ripple’s reputation as a company is in jeopardy. While the XRP Army has contested the claims made by Bloomberg in Forbes, the news is still brewing.
Whether or not Ripple is using XRP to conduct pump and dump schemes is unknown. However, this graphic organizer created by Bloomberg does not appear to bode well for the company or the cryptocurrency:
Ripple Versus JP Morgan?
‘Competition’ has heated up for Ripple as the investing giant JP Morgan unveiled plans for an in-house instant payment settling ‘cryptocurrency’ which it has dubbed JPM Coin. It is unlikely that the two digital currencies would have much market interaction as JPM Coin aims to be a pegged stablecoin used within its platform while XRP is a tradable asset for cross-border payments.
Ripple = Regulated
(XRP) is unique to other crypto offerings in that it is regulated. This key difference has enabled the Ripple company to partner with traditional financial institutions, who require more stringent regulatory compliance than typical cryptocurrencies are capable of doing. Together, Ripple and various fiat entities are attempting to achieve real-time financial transactions at a very low cost.
Fast, Cheap Transactions
In the current international transaction market, cross-border payments can take days or even weeks, costing annual fees in the trillions. XRP token-based payments have the potential to cut those costs by up to 60 percent.
The true strength of Ripple (XRP) lies in its fast transaction speeds. The average Ripple transaction takes approximately three seconds to complete.
Transactions on the Bitcoin (BTC) mainnet can take much longer—offering XRP apparent competitive advantage. However, the Lightning Network may offer Bitcoin a way to increase transaction speed to erase this advantage.
Furthermore, XRP is used primarily by Ripple’s clients. Its audience may be much more limited than Bitcoin’s, and fast transaction speeds may not be enough to threaten Bitcoin’s dominance—especially not as long as Bitcoin can make use of side-chains.
Other competitors with similarly fast transaction speeds include:
- Stellar (XLM) boasting two to five-second transactions
- Nano (NANO) with instant transfers and zero fees
- SWIFT: a Belgium-based payment facilitator.
Partnerships
In an effort to bring its unique platform to mainstream financial markets, Ripple has entered into strategic partnerships with over 150 banks internationally over the past five years. The goal of these partnerships is to enable widespread instant or near-instant transactions available at very low cost.
Ripple has ties to major financial institutions such as American Express (NYSE:AXP), Bank of America (NYSE:BAC), RBC, Santander (MC:SAN), and most recently, J.P. Morgan.
Unique Enterprise Services
Ripple regularly releases new enterprise services for its clients. These include:
- xCurrent: Integrates XRP with global payment processing for banks
- xRapid: Offers payment processors on-demand liquidity using XRP
- xVia: Allows business to send payments using XRP across the Ripple network (RippleNet)
These services, coupled with Ripple’s unique consensus mechanism protocol—which validates balances and transactions while stopping malicious entries—have also XRP’s market value.
Technical Analysis
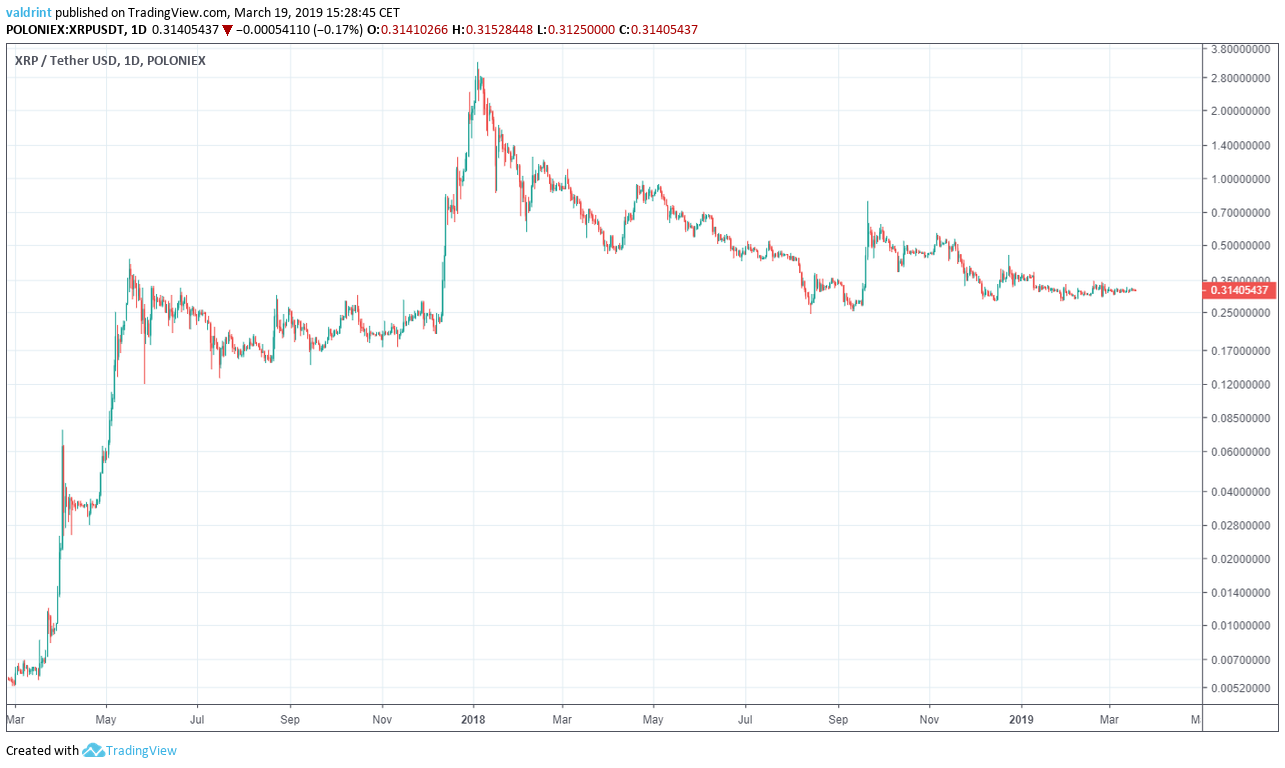
In Mar 2017, the price of XRP (XRP) made a bottom of $0.005. Rapid increases led ot prices over $0.40 in May.
A gradual decrease ensued that brought with a low of $0.13 experienced in July. Steady and rapid price increases followed over the throughout the rest of the year. By January 2018, XRP reached a high of $3.
Gradual price increases have since followed. A low of around $0.26 was experienced in September 2018. Since then, prices have increased and are currently trading at between $0.31 and $0.32.
Here is a look at prices in the period from Mar 2017 to Mar 2019:
Rate of Increase
The price of XRP on Poloniex is analyzed at one-day intervals from Mar 2017 to Mar 2019. In order to better visualize large price fluctuations, logarithmic charts are used in this analysis.
On May 2017, the price reached a high of $0.41. Approximately two months later, XRP had lost approximately 72% of its value. In July, the cryptocurrency bottomed out at around $0.13.
A reversal brought XRP to a of $3 in January 2018. Another price drop followed. This time XRP lost around 92% of its —bottoming out at around $0.26 in September 2018.
The ratio between the second and the first drops is 92/77— or 1.27.
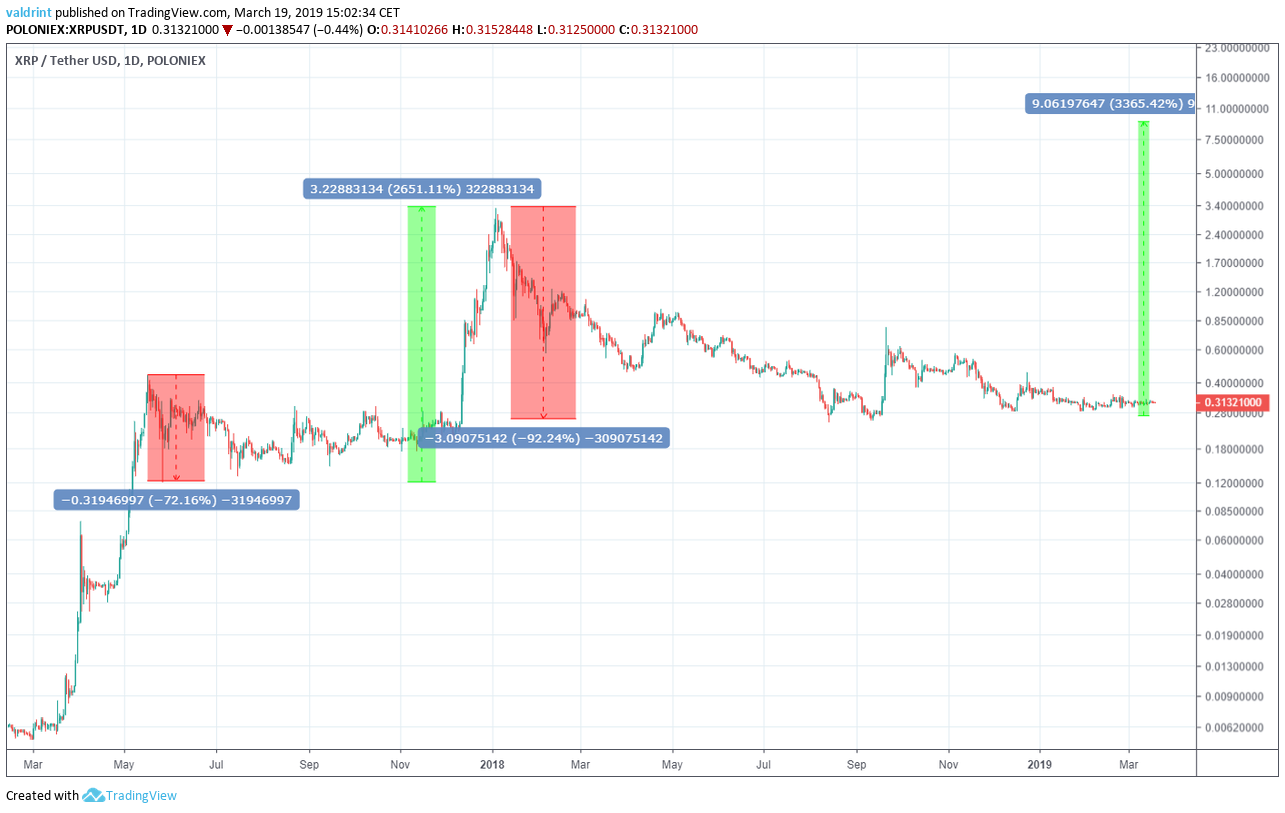
We are going to operate on the assumption that the rebound from the bottom to the next high will follow a pattern similar to the one in 2017.
After making a bottom at $0.13, the price increased to a high of $3. This is an increase of 2651%.
Since the decrease in the 2018 crash was 1.27 times larger than the correction in 2017, we are going to assume that the increase will be the same. However, the rate of increase may be drastically different. We are extrapolating from a limited data set and assuming patterns that have not definitively emerged. If our predictions are validated, the patterns we have defined will be validated as well.
Based on this assumption and measuring from the $0.26 bottom, we predict that the price may increase by 3365%, reaching a high of $9.06. We will round this number to $9 and use it as an approximate value in the rest of the analysis.
Even if this assumption is accurate, however, we do not know when the pattern will occur. For this, we must analyze the data using technical indicators.
Time Periods
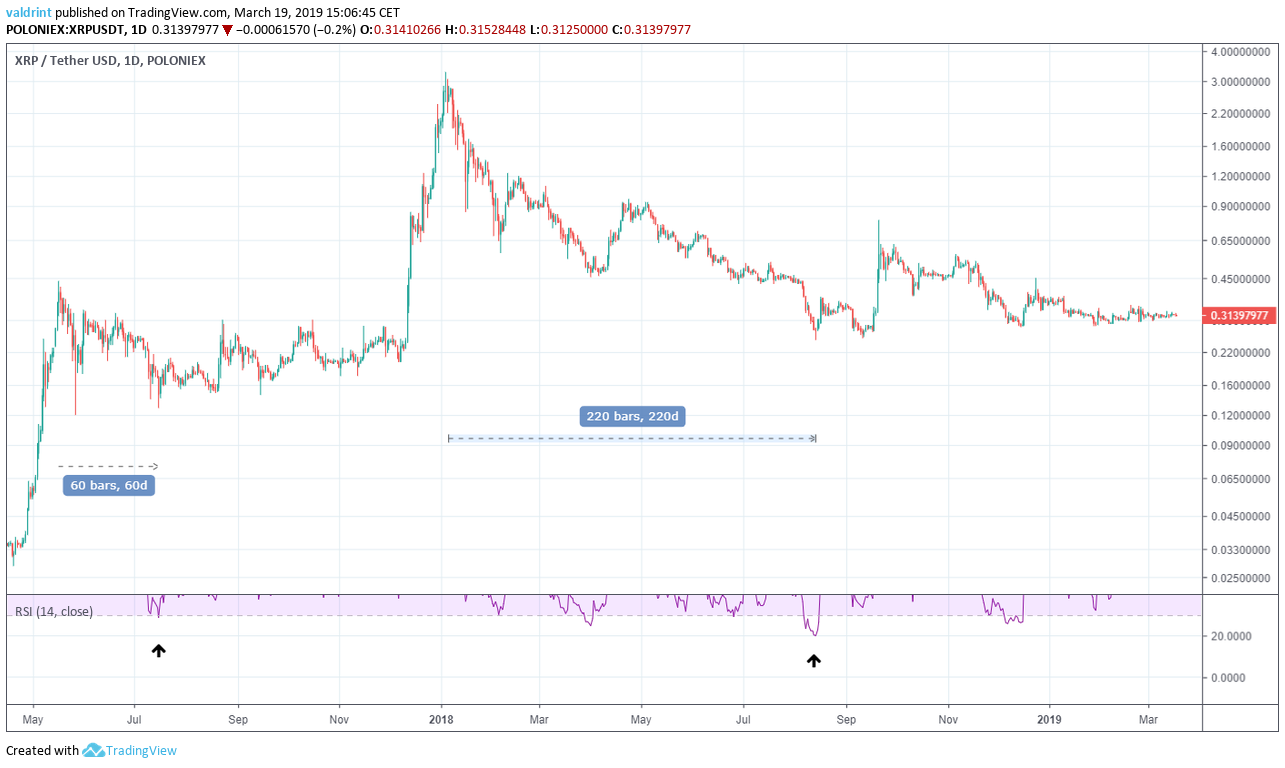
In order to figure out where our current position relative to the 2017 correction, we are going to use the RSI.
The relative strength index (RSI) is an indicator which calculates the size of the changes in price in order to determine oversold or overbought conditions in the market.
In the 2017 correction, the lowest RSI value recorded was 25. This occurred 60 days after the $0.41 high.
Currently, the lowest value recorded has been 22. It occurred 220 days after the $3 high.
Therefore, we are making the assumption that current price movements take 3.66 (220/60) times longer than they did in 2017.
Now, since we have the time period ratio, all we need to do is to find out the price in 2017 which corresponds with the potential end of 2019 price.
By applying the price and time ratios from the 2017 correction to the future, we assume both the that the pattern will be validated and that it will be validated over the time period we’ve defined. It is possible that either or both of these conditions may not be met. The predictions below will have to reevaluated at the proper time in order to determine (a) if the pattern is true, (b) if the time periods defined for the pattern are accurate, and (c) if our predictions based on (a) and (b) are valid.
What About the $9 High?
First, let us find out when the $9 high figured in the first section will occur based on our assumptions of the time period in which the defined pattern should take place.
It took 173 days from the $0.13 bottom on Jul 2017 for the price to reach $3.
Therefore, using the time ratio, we predict that it will take approximately 633 days from the $0.26 Aug bottom to reach $9. Therefore, $9 may be reached around May of 2020. 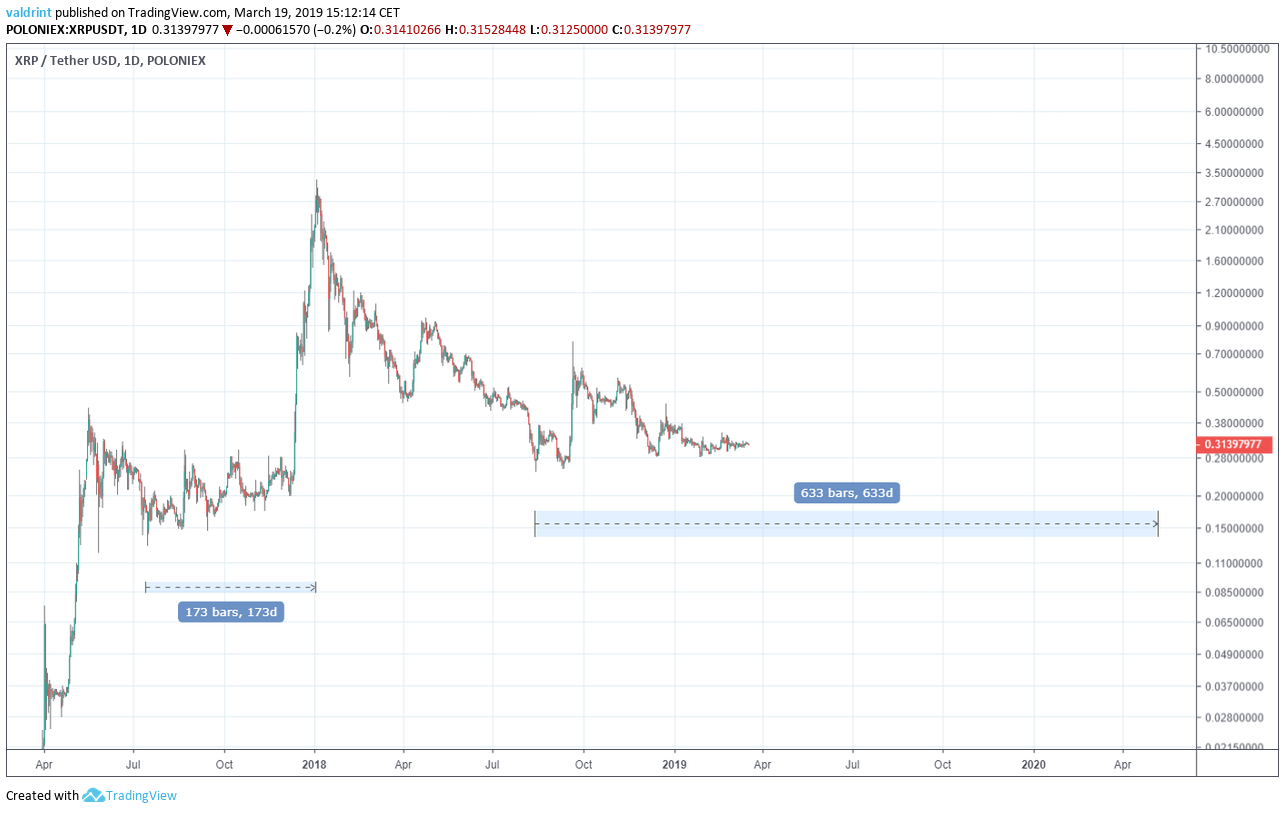
XRP Price Prediction 2019
In order to find the price at the end of 2019, we count the number of days from the $0.26 Aug 2018 bottom to the end of 2019. There are 505 days from the bottom to Dec 31, 2019.
Afterward, we use the time ratio in order to find the equivalent price in the 2017 correction. In order to do that, we will add 137 days to the $0.14 Jul 2017 bottom.
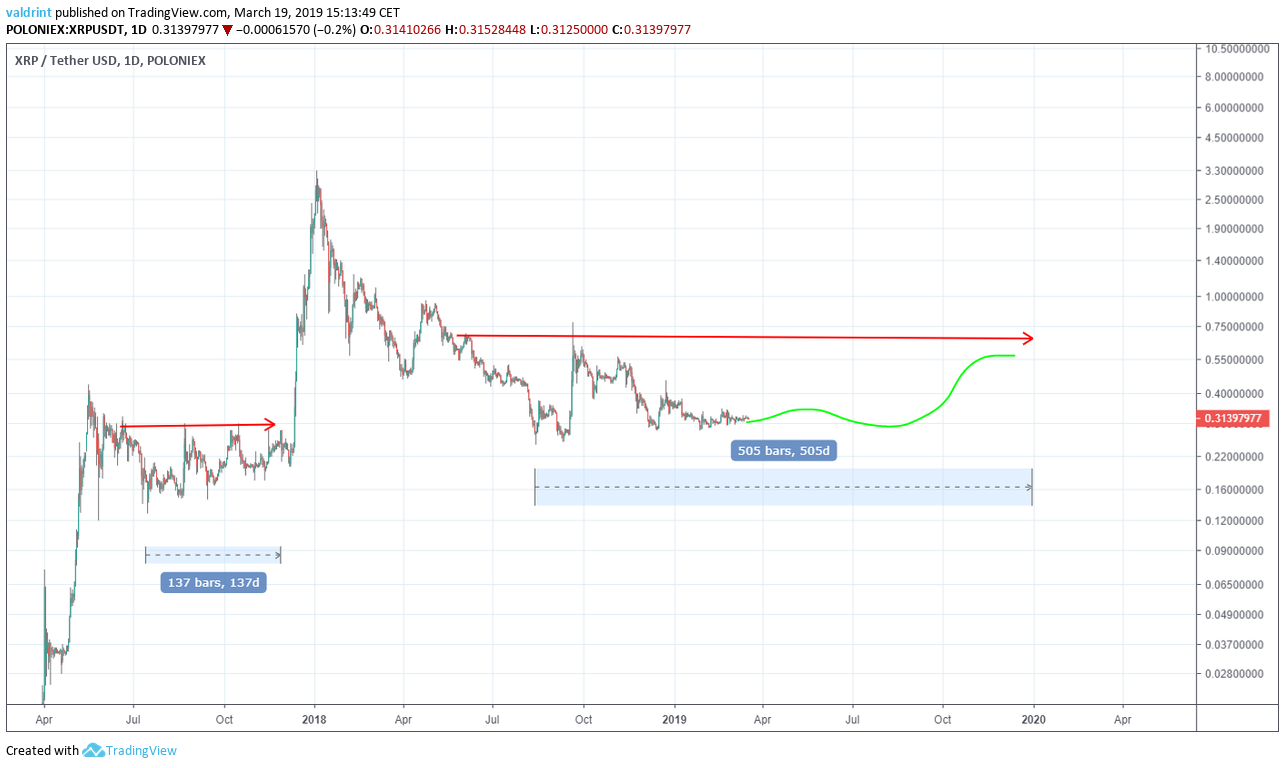
On Nov 2017, 137 days after Jul bottom, the price reached a high of $0.2. By outlining price movements in the future, we arrive at a price of between $0.55 and $0.65 for the end of 2019.
XRP Price Prediction 2020
In order to find the price at the end of 2019, we count the number of days from the Aug 2018 bottom to the end of 2020. There are 874 days from the Aug 2018 bottom to Dec 31, 2020.
We use the time ratio in order to find the equivalent price after the 2017 correction. We do that by adding 236 days to the Jul 2017 low.
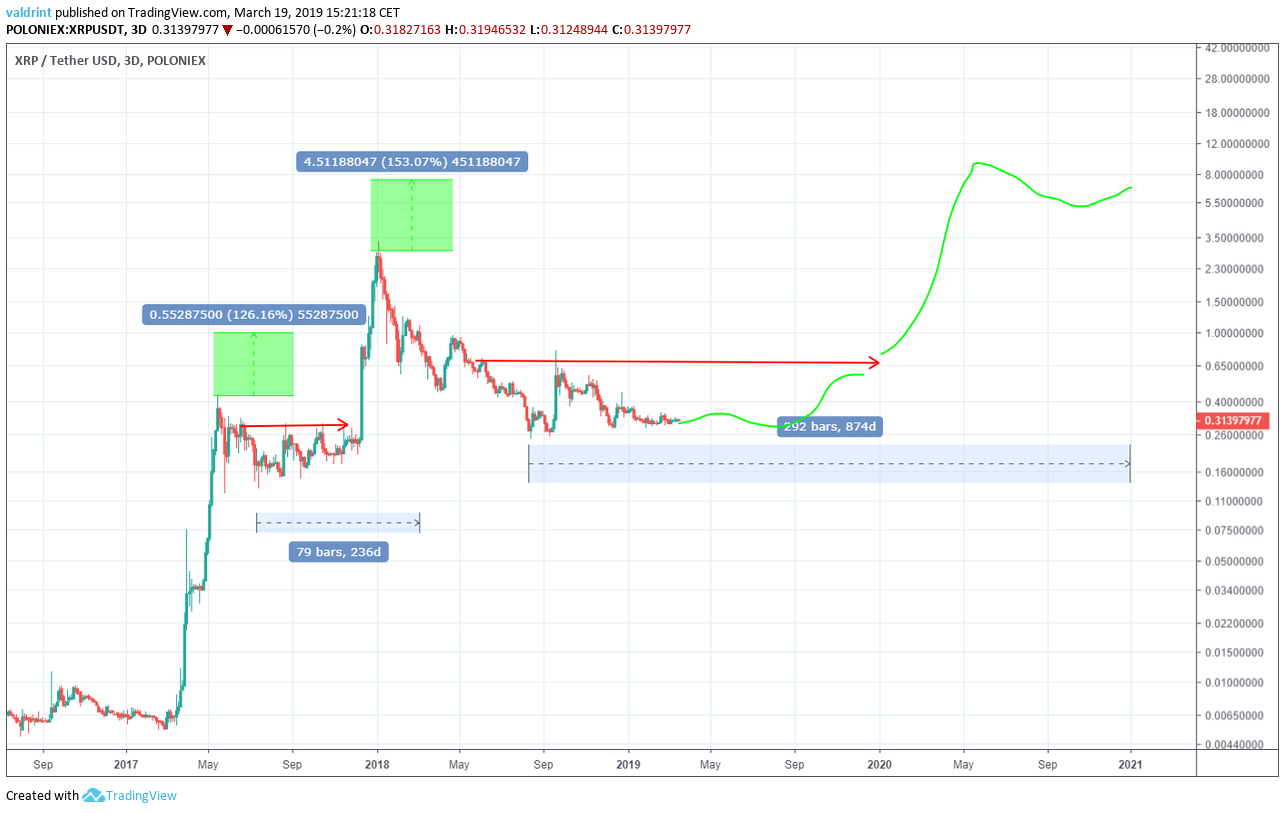
In May 2017, 236 days after the Jul 2017 low, the price was at $0.41. The price represents a 126% increase from the $0.41 high on May 2017.
Now, we use the 1.27 price ratio found in the first section and measure a 153% increase from the $3 January high. We arrive at a price between $6.5 and $7.5 for the end of 2020.
Summary of Analysis
There are several similarities between the 2017 and 2018 corrections—namely the degree of price fluctuations, the length of time taken to generate downward movement, and rapid price increase preceding gradual decreases.
The following predictions are made with the assumption that price will follow the pattern laid out in the previous correction and on the time tables we defined:
- The price will be between $0.5 and $0.6 in Dec 2019.
- The price will reach highs of around $9 in the spring of 2020 following a rapid price increase.
- Gradual losses will lead price to rest within the $6.50 and $7.50 by Dec 2020.
Until these prices are validated, the patterns we define cannot be considered accurate indicators of future prices. Validation of these prices, however, would also validate the accuracy of the pattern we have isolated. At the end of 2019, we will return to these predictions to assess whether the pattern appears to be holding true or not.
Conclusion
As noted our price predictions are based on a number of assumptions. There are a number of reasons why they might be invalidated.
Among these is the growing controversy currently facing XRP. If these worsen, the reputation of XRP could be negatively affected. If a sufficient number of traders, investors, and holders of XRP begin to believe that Ripple is a pump and dump scheme or that members of its team are involved insider trading, then sell-offs, decreased demands, and bad publicity may negatively harm XRP’s trading value.
However, if XRP can continue to prove its usability to financial institutions and payment providers, it could rise above these controversies. Given that qualitative factors bode well for XRP, it is possible that the prices will rise to the highs we’ve predicted.
At BeinCrypto, our current prediction for XRP is based on our belief that Ripple continues to strengthen an already solid product. We believe that XRP is a solid investment, both long-term and short-term, with potential upward growth over the next several years; however, we are not providing investment advice. We are making predictions based on assumptions that may or may not prove to be true.
As always, we are cautious in making any solid forecasts while cryptocurrency as a whole remains in the throes of this bear market. However, Ripple offerings are valuable for fiat and digital currency alike, and with few competitors showing the depth and commitment of XRP’s platform and future developments, we are confident this coin is a solid investment.
Disclaimer: This article is not meant to be used as personal investment advice, nor is it information from a qualified investment advisor. Cryptocurrency is a notoriously risky investment, and it is possible to lose everything. Please conduct your own research and investigation prior to investing in cryptocurrency.