
- The market expected a 56 bcf injection into storage
- Natural gas backs off from the recent high
- Support levels rise, but bearish speculators could return to the market
Now that the Labor Day holiday has passed, the markets turn their focus to the fall and winter seasons. In the world of commodities, seasonality is a significant factor that can drive prices.
Each year, the injection season in the natural gas market begins in March and runs through November. The energy commodity flows into storage around the U.S. to build up stockpiles for the peak season of demand that runs from November through March. The end of the summer is a reminder that the withdrawal season where inventories decline is around the corner, and just about 10 weeks away.
The price of natural gas rose to a new high for 2020 in August when the nearby NYMEX futures contract rose to $2.743 per MMBtu. This week, the price was back below $2.50. On Thursday, Sept. 10, the Energy Information Administration reported its first natural gas inventory data for September. The United States Natural Gas Fund (NYSE:UNG) tracks the price of the energy commodity.
Market Expected 56 BCF Injection Into Storage
According to Estimize, a crowdsourcing website, the natural gas market had expected an injection into storage of 56 billion cubic feet for the week ending on September 4, 2020.
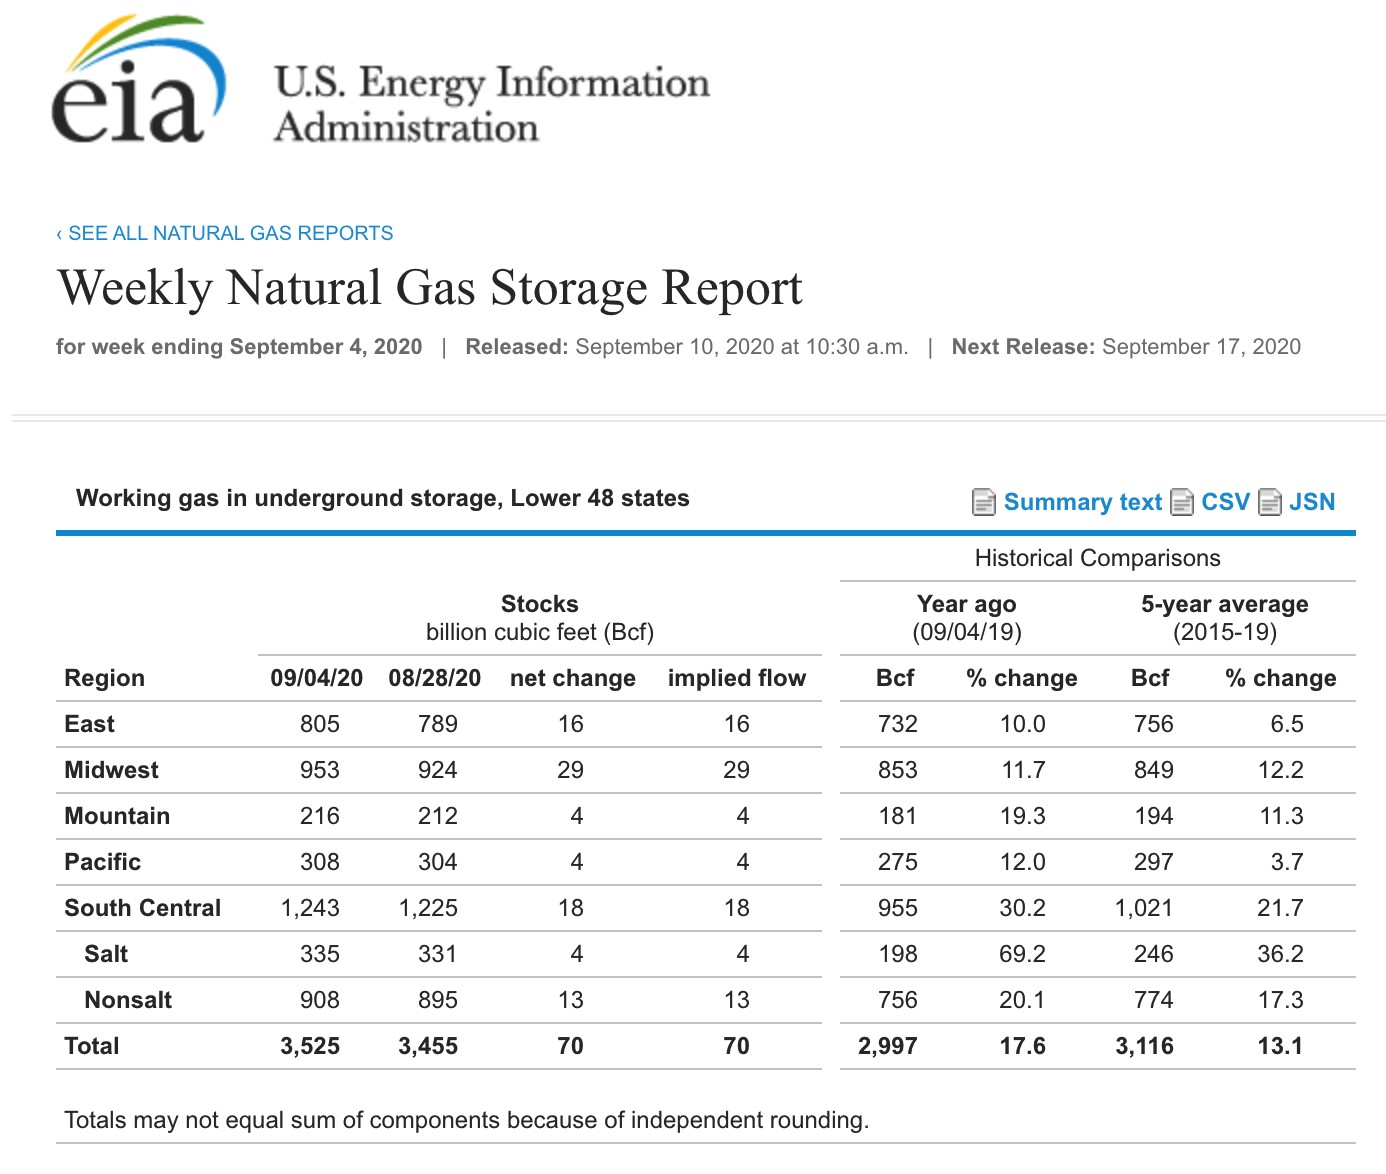
Source: EIA
As the chart highlights, the EIA reported the highest injection since the week of June 19, with 70 bcf flowing into inventories. The total amount of natural gas sitting in storage across the US was at 3.525 trillion cubic feet in early September, 17.6% above last year and 13.1 % over the five-year average. While it was the 23rd consecutive week where the percentage above last year’s level was lower than the previous week, stocks remain at an elevated level.
With approximately 10 weeks left in the injection season, an average inventory build of only 20.7 bcf would push stockpiles to last year’s high of 3.732 tcf. Meanwhile, if stocks increase by an average of 47.5 bcf until early November, supplies will rise to the four trillion cubic feet level for the third time since the EIA began reporting data. Inventories remain bearish for the natural gas market, but the price action following the latest data was not.
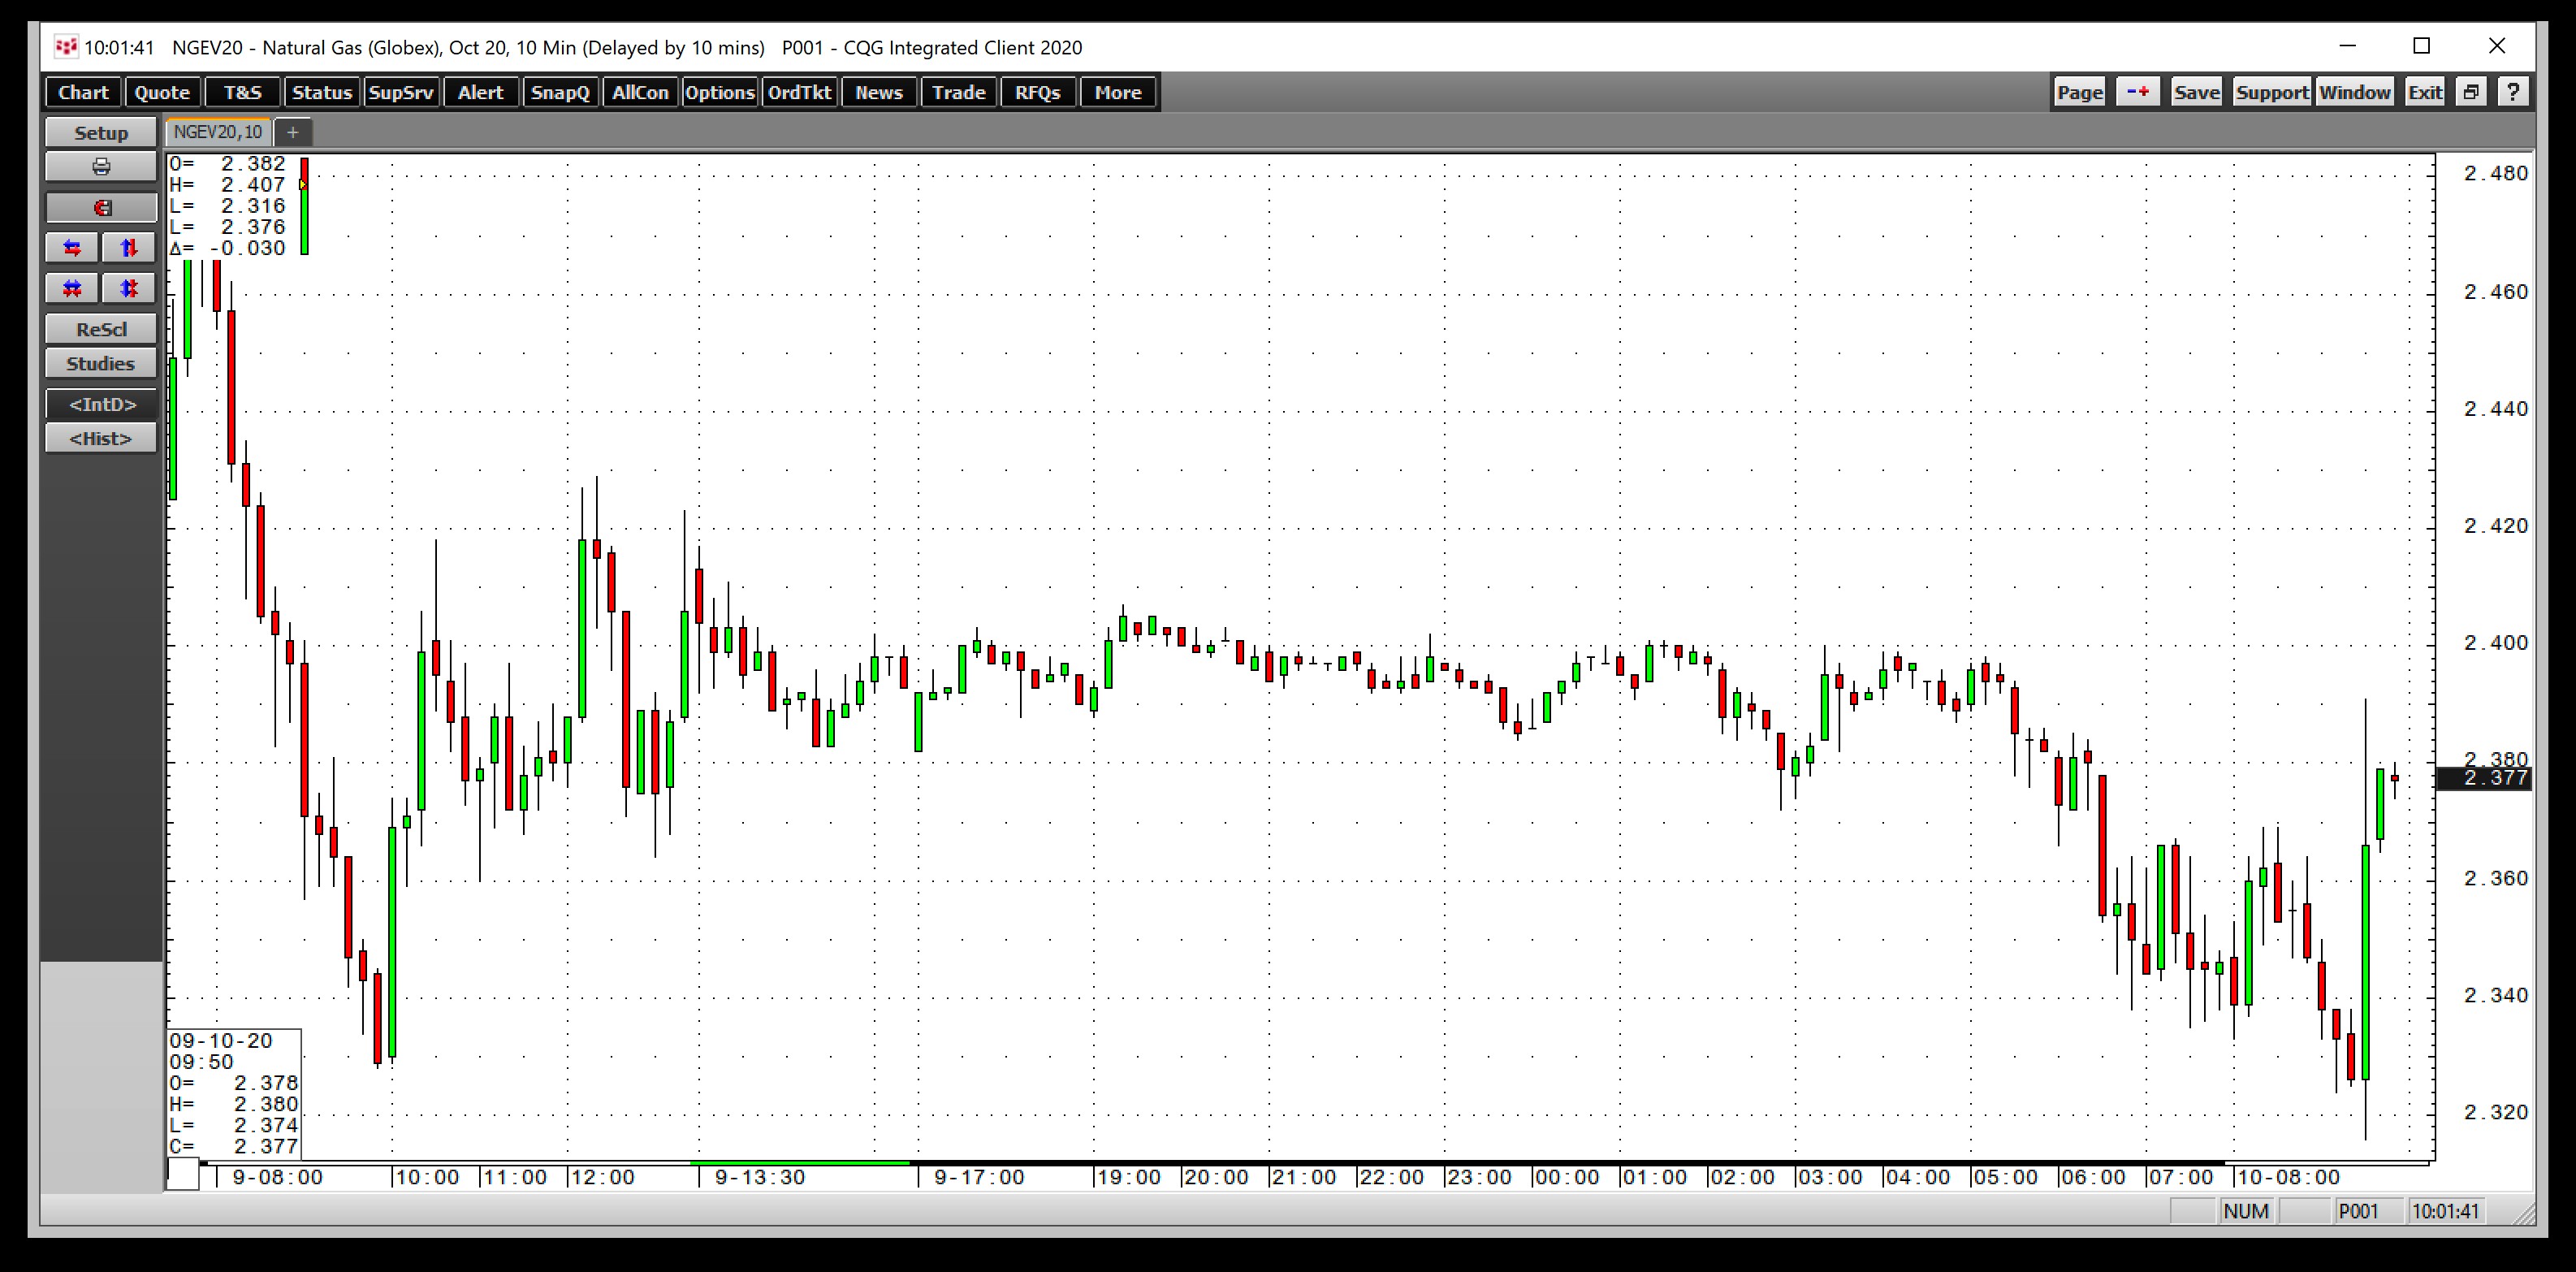
Source: EIA
The 10-minute chart shows that October natural gas futures on NYMEX moved from a low of $2.316 per MMBtu to a high of $2.391 after the release of the latest data.
Natural Gas Backs Off From Recent High
At below the $2.40 level on Sept. 10, natural gas corrected from the late August high that took the price to a new peak for 2020.
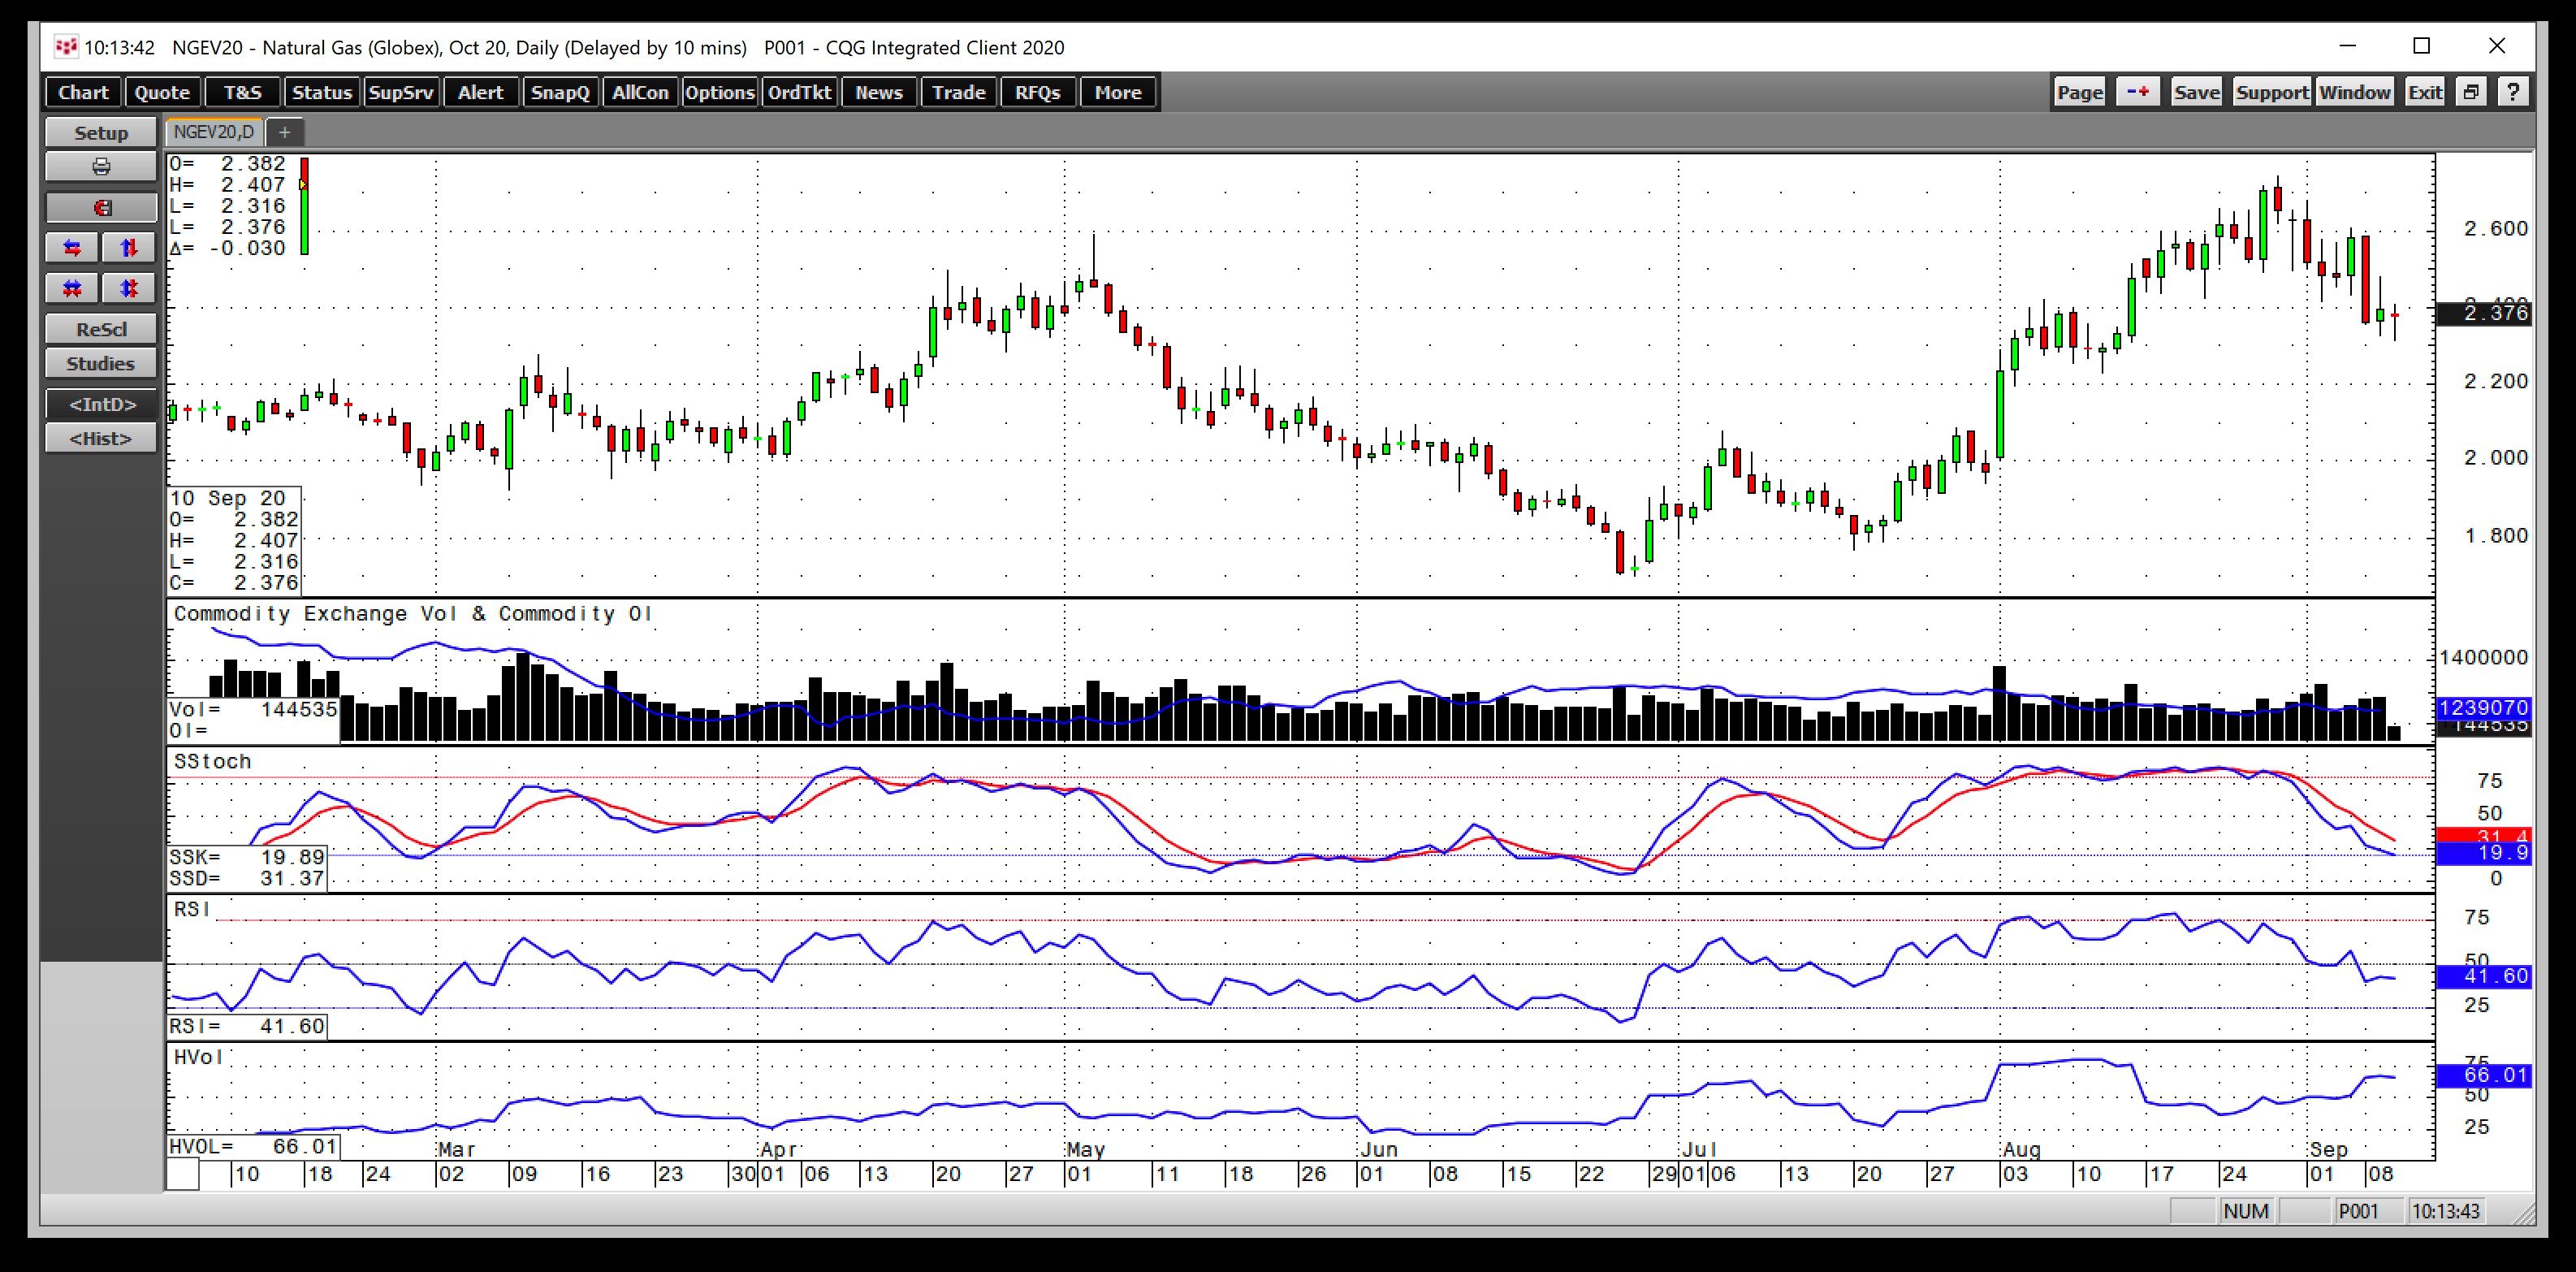
Source: CQG
As the daily chart of October futures illustrates, natural gas rose from a low of $1.70 per MMBtu on June 26 to a high of $2.743 on August 28 or 61.4%. The continuous contract low at $1.432 took the price over 91.5% higher. The price was below the $2.40 level after the EIA data on Thursday. The most recent low was at $2.316 per MMBtu. Price momentum and relative strength indicators were falling with the slow stochastic approaching an oversold reading. The total number of open long and short positions has not moved much since the energy commodity was on its high on Aug. 28. The metric moved from 1.236 million to 1.239 million contracts. However, daily historical volatility rose from 45.88% to over 66% as daily trading ranges expanded.
Support Levels Rise, But Bearish Speculators Could Return To Market
The first level of support for the October contract now stands at the Aug. 12 low of $2.228. Below there, $2 is a psychological support level with $1.768, and $1.70 per MMBtu are the levels to watch on the downside. From a longer-term perspective, the late June low of $1.432 is the critical technical support level in the natural gas market.
In approximately ten weeks, natural gas will move into the peak season for demand as heating requirements will rise during the winter months. With stockpiles heading for a higher level than last year and the potential for a rise to over the four trillion cubic feet level, speculative shorts could attempt to push the price of the energy commodity lower over the coming sessions. Technical resistance is at just below $2.75 per MMBtu, the recent high.
The EIA’s latest data was bearish, but the time for another push lower is running short as the winter season of 2020/2021 approaches.