
Verizon Communications Inc. (NYSE:VZ) is scheduled to release second-quarter 2019 results before the opening bell on Aug 1. The company is likely to record lower year-over-year revenues from the Wireline segment owing to secular pressure from legacy technologies.
Whether this will hurt the bottom line of the company remains to be seen.
Key Factors
Verizon is facing a steady decline in legacy wireline services due to competitive pressure from voice-over-Internet protocol service providers and aggressive triple-play (voice, data, video) offerings by the cable companies. The company is continually losing Fios Video connections amid pressure from cord-cutting of video bundles, as consumers are increasingly cancelling pay TV packages for cheaper streaming options from Netflix (NASDAQ:NFLX), Amazon (NASDAQ:AMZN), Hulu and other services. Verizon expects the secular and pricing pressure to affect its second-quarter Wireline revenues, undermining the overall quarterly performance.
In order to make wireline profitable, Verizon is making significant investments and is streamlining its cost structure. The company has embarked on ‘One Fiber’ initiative that aims to build a single, highly-resilient and scalable fiber network to offer advanced data services to customers across consumer, business and enterprise customer groups. This, in turn, is likely to weigh on margins and strain its bottom line in the quarter. Wireline EBITDA for the second quarter is expected to be $1,428 million compared with $1,505 million recorded in the year-ago quarter.
The Zacks Consensus Estimate for revenues from the Wireline segment is pegged at $7,205 million. The segment reported $7,459 million a year ago. The lower revenue expectations can be attributed to soft demand and cheaper competitive options.
Total revenues for the company are expected to be $32,395 million. It generated revenues of $32,203 million in the prior-year quarter. (Read More: Can Higher Wireless Revenues Buoy Verizon Q2 Earnings?)
Earnings Whispers
Our proven model shows that Verizon is likely to beat earnings in the second quarter as it possesses the key components. A stock needs to have both a positive Earnings ESP and a Zacks Rank #1 (Strong Buy), 2 (Buy) or 3 (Hold) for this to happen. This is perfectly the case here as you will see below:
Earnings ESP: Earnings ESP, which represents the difference between the Most Accurate Estimate and the Zacks Consensus Estimate, is +0.52% with the former pegged at $1.21 and the latter at $1.20. You can uncover the best stocks to buy or sell before they’re reported with our Earnings ESP Filter.
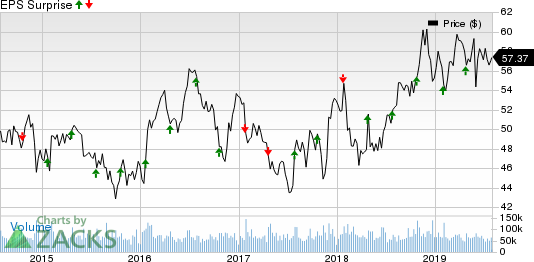
Verizon Communications Inc. Price and EPS Surprise
Verizon Communications Inc. price-eps-surprise | Verizon Communications Inc. Quote
Zacks Rank: Verizon has a Zacks Rank #3. This increases the predictive power of our model and a positive ESP makes us reasonably confident of an earnings beat.
Note that we caution against stocks with a Zacks Rank #4 or 5 (Sell-rated) going into the earnings announcement, especially when the company is seeing a negative estimate revisions momentum.
Other Stocks to Consider
Here are some other companies that you may want to consider, as our model shows that these have the right combination of elements to post an earnings beat this quarter:
Ciena Corporation (NYSE:CIEN) is set to release quarterly numbers on Aug 29. It has an Earnings ESP of +5.26% and a Zacks Rank #2. You can see the complete list of today’s Zacks #1 Rank stocks here.
The Earnings ESP for Motorola Solutions, Inc. (NYSE:MSI) is +1.25% and it carries a Zacks Rank of 3. The company is set to report quarterly numbers on Aug 1.
The Earnings ESP for TELUS Corporation (NYSE:TU) is +2.61% and it carries a Zacks Rank of 2. The company is slated to report quarterly numbers on Aug 2.
Today's Best Stocks from Zacks
Would you like to see the updated picks from our best market-beating strategies? From 2017 through 2018, while the S&P 500 gained +15.8%, five of our screens returned +38.0%, +61.3%, +61.6%, +68.1%, and +98.3%.
This outperformance has not just been a recent phenomenon. From 2000 – 2018, while the S&P averaged +4.8% per year, our top strategies averaged up to +56.2% per year.
See their latest picks free >>
Motorola Solutions, Inc. (MSI): Free Stock Analysis Report
Verizon Communications Inc. (VZ): Free Stock Analysis Report
TELUS Corporation (TU): Free Stock Analysis Report
Ciena Corporation (CIEN): Free Stock Analysis Report
Original post
Zacks Investment Research