The March payrolls and ISM manufacturing data were the big events last Friday. While the NFP was mixed, the ISM manufacturing posted a strong upside surprise, but the dollar was unimpressed, closing Friday's session weaker. With a new week ahead, the US dollar could be looking to regain some lost ground in the near-term, which should see a pullback across most of the USD crosses.
EUR/USD Daily Analysis

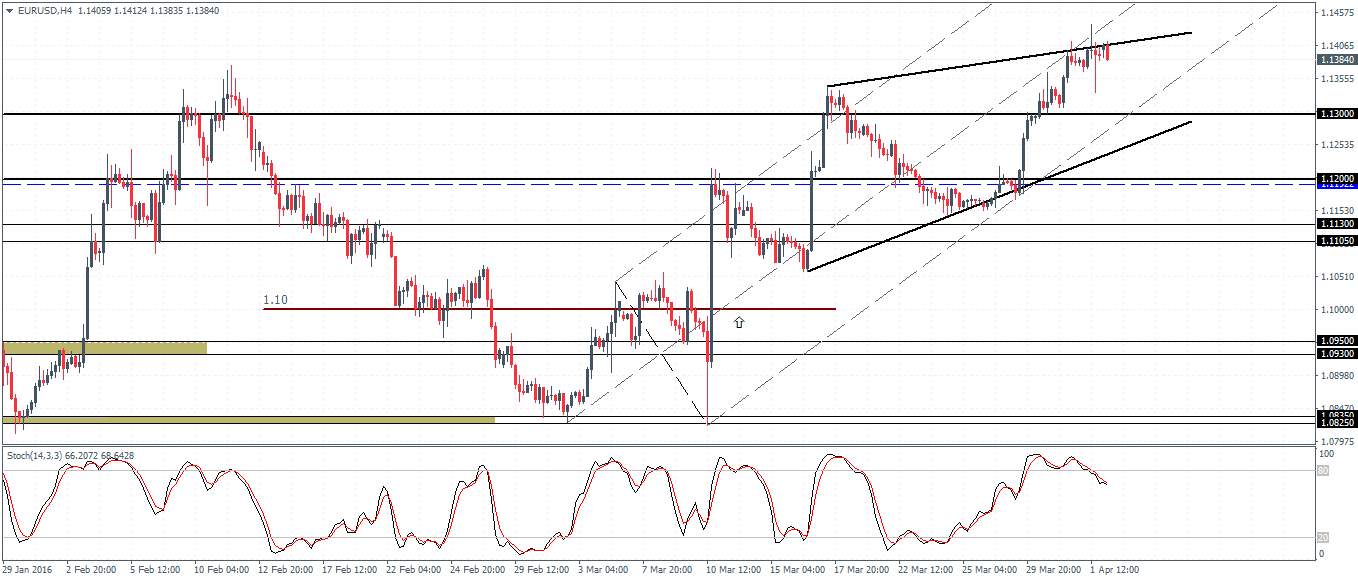
EUR/USD (1.13): EUR/USD closed Friday's session above 1.13, settling at 1.139. Price action closed with a small bodied candlestick pattern, and if today's session closes on a bearish note, we can anticipate a short-term correction lower. However, prices remain biased to the upside, with the previously broken resistance at 1.13 now likely to turn into support. In thecase of a dip below 1.13, 1.12 support comes into play next. To the upside, 1.147 which marks the September 14th 2015 higher close, will be the next resistance level of interest.
USD/JPY Daily Analysis

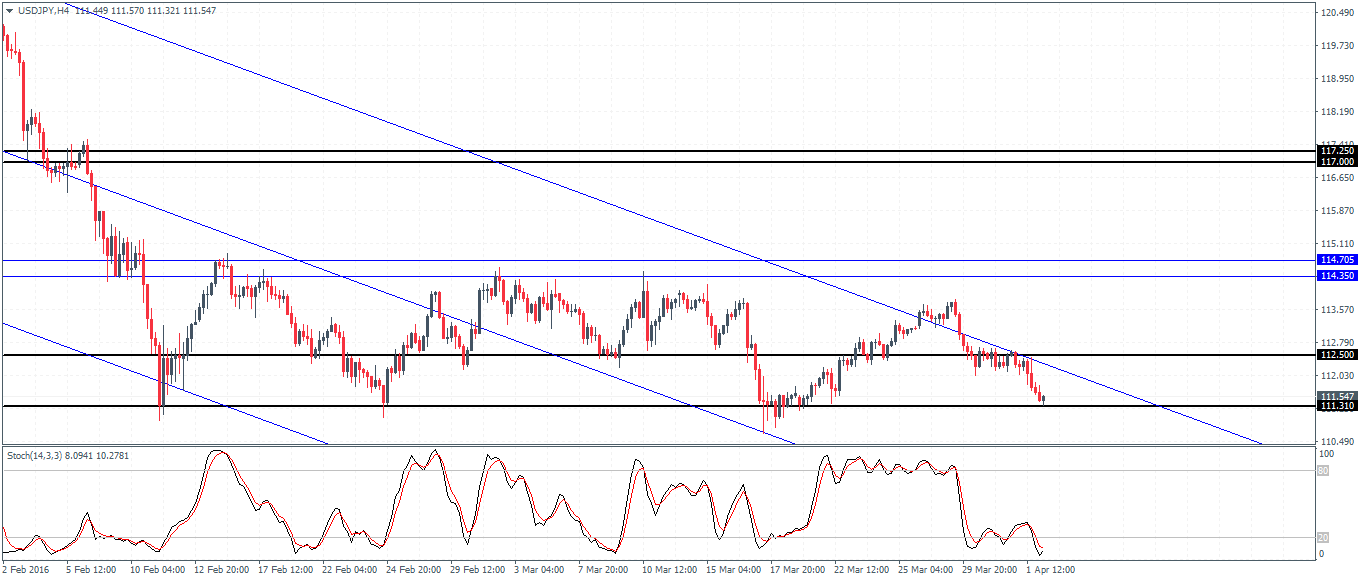
USD/JPY (111.5): USD/JPY slipped below 112.0 support on Friday, closing with a strong bearish engulfing candlestick pattern which could indicate further downside. Prices are currently supported near the lows of 111.430, which previously held on March 17th. A daily close below this level could see further downside, but in the event of a move above 112.0 USD/JPY could see some of the losses being reclaimed. On the 4-hour chart, resistance can be seen at 112.0 - 112.50 levels, and an upside bias will be built only on a close above this resistance level for a test to 114.35 - 114.7.
GBP/USD Daily Analysis

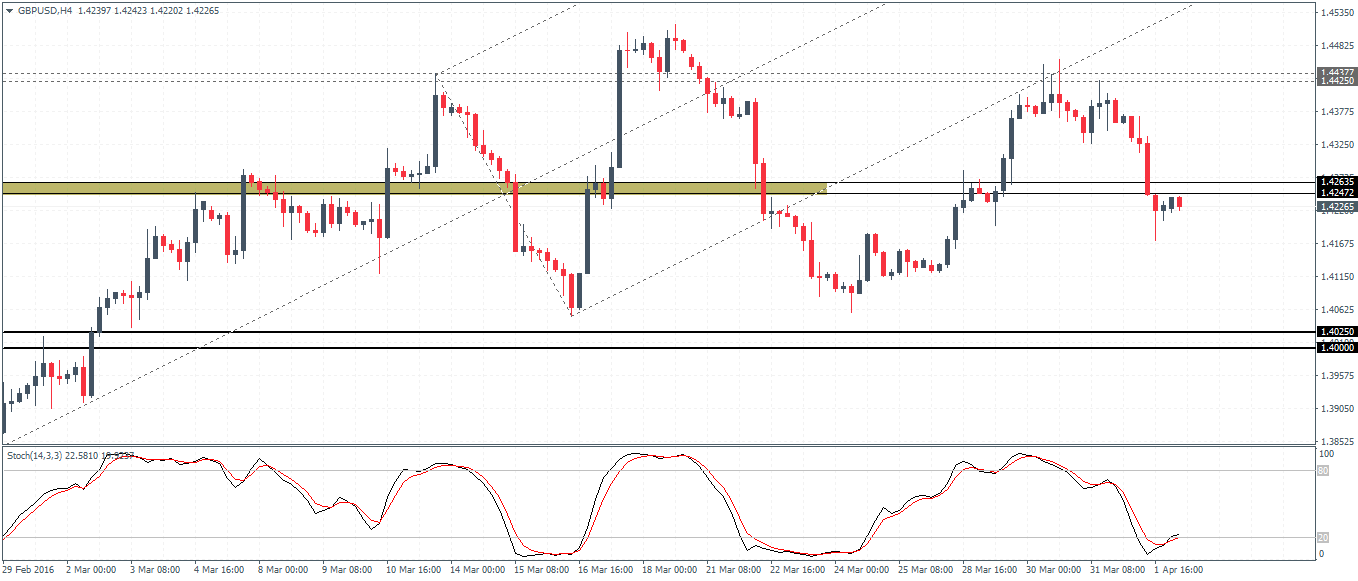
GBP/USD (1.42): GBP/USD closed Friday's session on a bearish note following the two doji candlesticks earlier in the week near 1.4425 resistance. Minor support at 1.42 was briefly tested on Friday, but we expect to see a further test back to this level. On the 4-hour chart, with the support level being cleared at 1.4263 - 1.4247, GBP/USD could see a continued downside move to 1.4025 - 1.40 lower support in the near-term.
Gold Daily Analysis

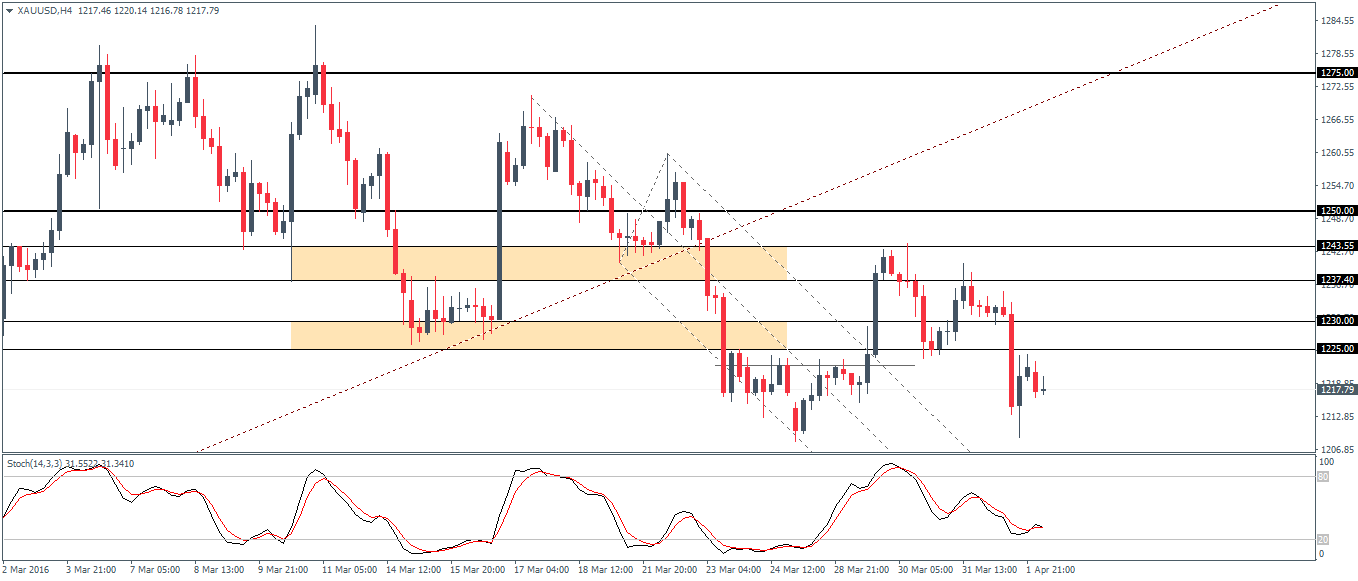
XAU/USD (1217): Gold prices continue to drift gradually lower. Price action was bearish on Friday, but the daily chart was supported by the 50 period EMA. On the 4-hour chart, prices closed below 1230 - 1225 support/resistance, which could confirm further downside. A brief retest to establish resistance at the newly broken support level would confirm the downside bias, which will see gold dip to the $1200 psychological support.
