Bitcoin (BTC-eUSD) markets have exhibited relative stability amidst volatility in the commodity markets. Oil dropped over 6% on Friday, while Bitcoin prices have remained fairly steady. The steep declines in the commodity markets could be boosting Bitcoin, as the trading volume in terms of Russian rubles has been steadily increasing. The fall in the purchasing power of the Russian ruble in response to lower oil prices may lead more Russians to purchase Bitcoin to maintain the purchasing power of their capital. Trading volumes additionally remained relatively flat on the weekend.
The Bitcoin volatility index, maintained by Eli Dourado from the Mercatus Centre, has been steadily falling since 2010, indicating that Bitcoin is becoming a more efficient store of value over time. The volatility in Bitcoin prices has reduced significantly since 2010 and this trend could continue and see crypto-currencies capture a share of the market value pie from other traditional assets.
The current price stands at $381.75 on the BitStamp, up $4.74 or 1.26% on today’s open. The price rose above the first Fibonacci daily resistance at $380.75 today, after being tested throughout the day. The next resistance level lies at $382.80 and the daily support lies at $374.13. The first weekly resistance lies at $390.88, while the first weekly support lies at $362.53.
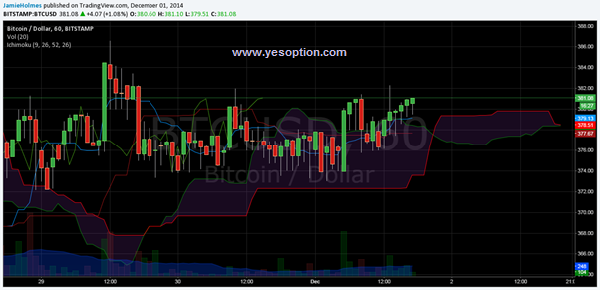
The chart below shows the hourly price action along with the Ichimoku cloud. A move of almost $6 was seen in the morning from $374 to just under $380 in an hour. The price has risen above the cloud, along with the lagging line, which has also broken above the previous price action. These are both strong bullish signals. Additionally, the conversion line is above the base line, indicating bullish momentum. The green span of the cloud appears ready to make an upward cross-over of the red span, which will be a strongly bullish signal. The cloud should provide support in the hours ahead at the $380-$378 level, as indicated by the cloud projected forward.

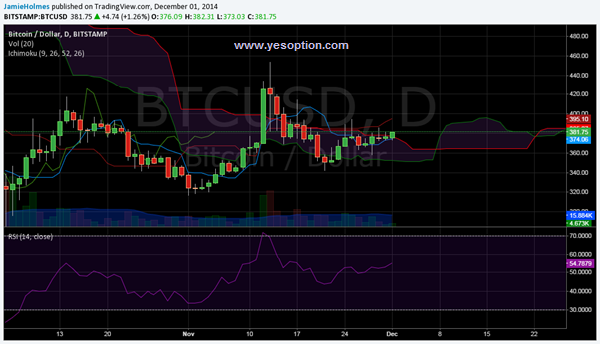
The chart below shows the daily price action on the BitStamp exchange. The price failed to close above the cloud on Sunday and if it closes today at least $377.40, then the price will have closed above the cloud, the first indication of an upward trend. The lagging line is moving up through the cloud and the upward trend should be confirmed when the lagging line pierces above the cloud. The green span is also crossing over the red span on the daily timeframe, which is a bullish indication. However the base line is still above the price, which is a weak bearish signal. If the price closes above the base line at $395.10, then this will signal bullish momentum and the price should accelerate upwards.

The relative strength index is additionally bullish, currently at 54.78, indicating an upward trend. Once the overbought zone is reached, at and above 70 for the RSI indicator, then it is expected that the price will tend towards the cloud. In the week ahead, support provided by the Ichimoku cloud should be found at around $364 and $352.
