Microsoft Corp (NASDAQ:MSFT) appears to be the main loser in the battle of acquiring the North American part of Tik-Tok’s operations, with Oracle (NYSE:ORCL) coming in as the “preferred technology partner” of the app owned by China’s ByteDance. With teens in no need to use Windows-powered PCs as they did in the past, Microsoft seems to have lost an opportunity to access their world. However, by missing out on the Tik-Tok deal, the firm may have also avoided the pain accompanied by entering the data-collecting field. Let’s not forget the scrutiny Google (NASDAQ:GOOGL) and Facebook (NASDAQ:FB) have drawn from regulators in the US and Europe exactly because of that.
Although it’s stock may perform somewhat poorly in the aftermath of the Tik-Tok related developments, with its more than USD 1trln market cap, the company may continue to do well on its own in the longer run, with Windows, productivity, and Xbox businesses still being the main source of its revenue.
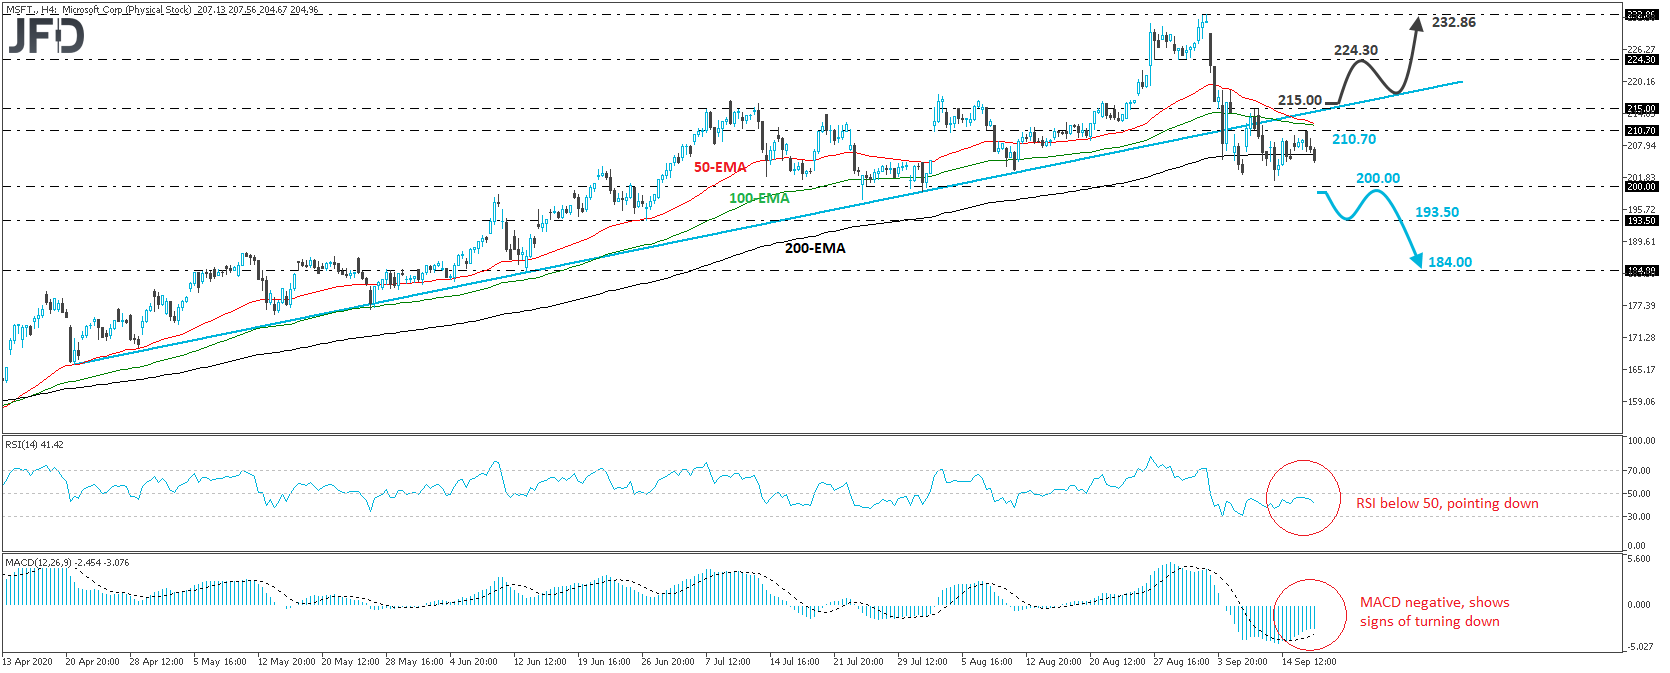
From the technical perspective, we see that the stock has been trading below an upside support line, drawn from the low of April 21st, since September 8th. However, it remains above the 200.00 zone, which has been acting as key support zone after it was broken to the upside on June 6th. Although the break below the upside line suggests that further declines may be on the cards, we prefer to wait for a dip below 200.00 before we get more confident on that front.
If such a dip occurs, the slide may be extended towards the low of June 29th, at around 193.50. If that barrier is not able to stop the fall either, then we may see investors allowing the retreat to continue towards the 184.00 territory, which is marked as a support by the low of June 15th.
Taking a look at our short-term oscillators, we see that the RSI has turned down from slightly below 50, while the MACD, although above its trigger line, lies within its negative territory and shows signs that it could turn south as well. Both indicators suggest that the stock may have started gaining downside speed, which supports the notion for some further short-term declines.
Now, in order to start examining the bullish case again, we would like to see a rebound back above 215.00. Something like that may also take the price back above the aforementioned upside support line and may initially pave the way towards the 224.30 barrier, marked as a resistance by the inside swing lows of August 31st and September 1st. Another break, above 224.30, may encourage advances toward the stock’s record high of 232.86, reached on September 2nd.