Get 40% Off
🤯 Perficient is up a mind-blowing 53%. Our ProPicks AI saw the buying opportunity in March.Read full update

Will Credit Markets Pull Stocks Down? Or Not?

Published 08/14/2020, 11:51 AM

Another day, another attempt at the February highs, and the upper knots of S&P 500 candlesticks give the daily chart a bearish look. How justified is that – are stocks about to move seriously lower?

In today's analysis, I'll present the outlook based on the many charts featured.

S&P 500 In The Short-Run

I’ll start with the daily chart perspective (charts courtesy of http://stockcharts.com):

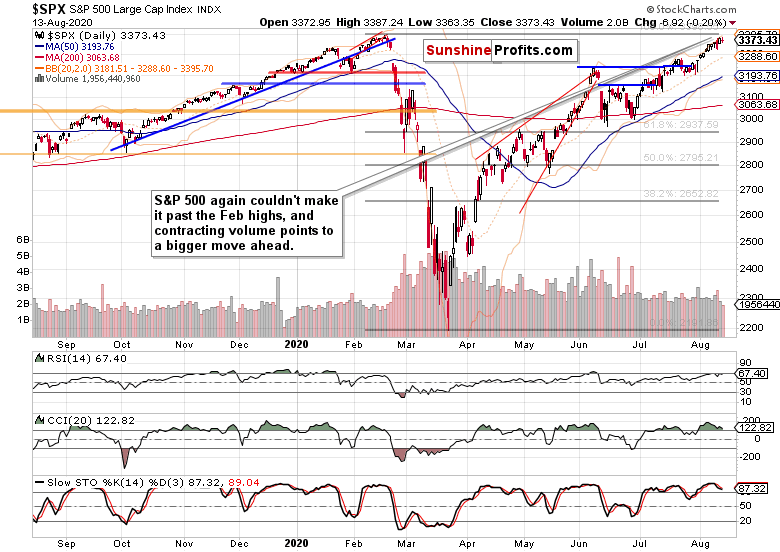
The S&P 500 didn't make it far yesterday, and both the upswings and downswings have been rejected. The volume declined, which means that most market participants are largely sitting on the sidelines.

However, this could cbange in a heartbeat. Will the bears be as strong so as to send the bulls packing?

According to the credit markets, it's a close or not so close tie – have your pick.

The Credit Markets’ Point of View

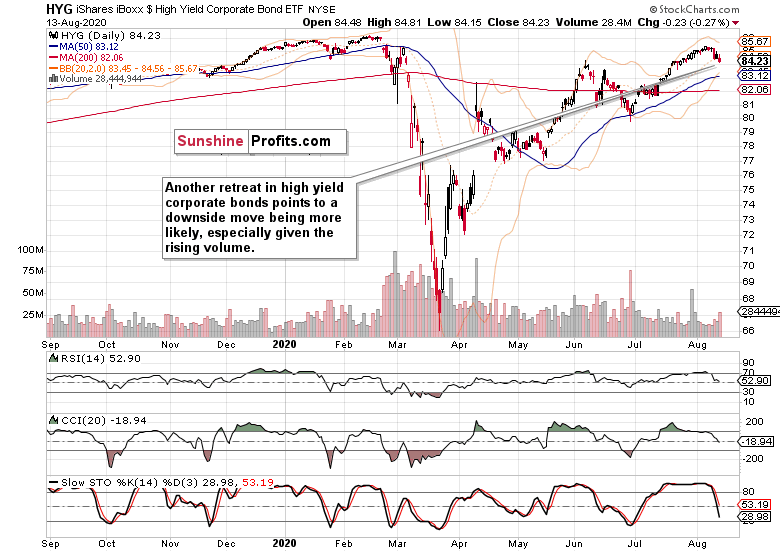
High yield corporate bonds (HYG ETF (NYSE:HYG)) recovery fizzled out yesterday, and prices closed at new lows. Does the high volume mean the bears are getting started, or that a meaningful accumulation is under way?

The next few days will be telling, especially when I look at investment grade corporate bonds (LQD ETF (NYSE:LQD)).They haven't found a bottom yet as the last five trading days in a row show.

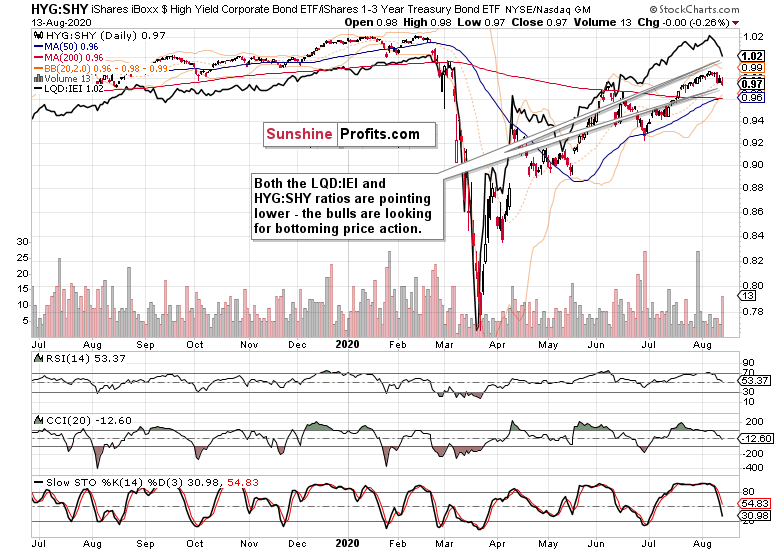
Both leading credit market ratios – high-yield corporate bonds to short-term Treasuries (HYG:SHY) and investment grade corporate bonds to longer-dated Treasuries (LQD:IEI) – are currently pointing down.

Will the investment grade bonds find the way higher first, just as they did in May or June – and will that be enough to promptly turn around their junk counterparts?

3rd party Ad. Not an offer or recommendation by Investing.com. See disclosure here or remove ads .

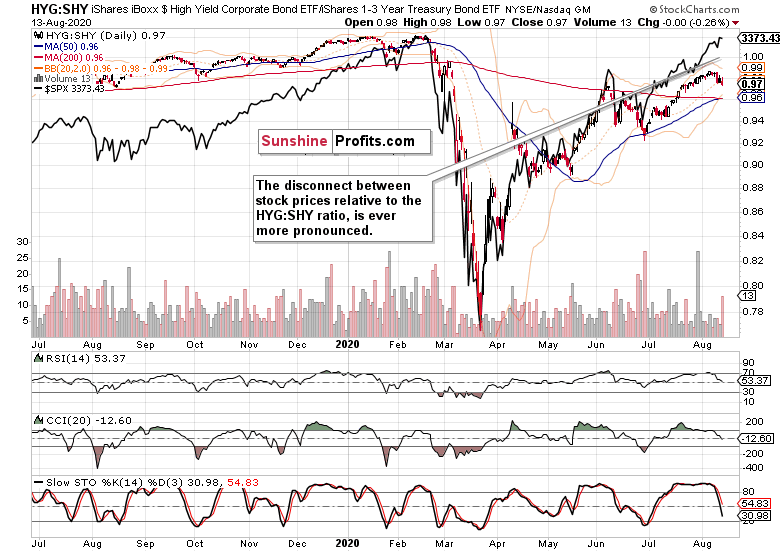
The overextension of the S&P 500 (black line) relative to the HYG:SHY ratio is even more striking now. But stocks still continue to defy gravity. Will a resolution with a stock move lower or ratio's move higher follow? I am leaning towards the latter, in its time that might be closer at hand than the bears think.

Smallcaps, Emerging Markets And Other Clues

The Russell 2000 (IWM ETF) is holding up quite well relative to the 500-strong index. No sign of profit distribution here.

Neither the emerging markets (EEM ETF (NYSE:EEM)) are signalling danger – after outperforming since the start of July, they're taking a breather currently.

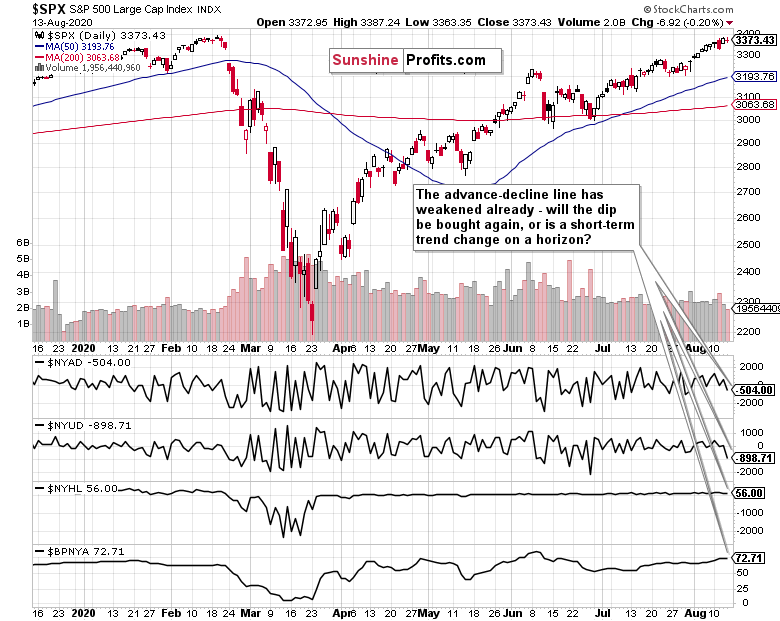
The daily market breadth chart caption says it all. The deterioration is visible, and the question remains when would the bulls step in. Remember, the bullish percent index remains solidly in bullish territory (making corrections likely to be bought), and stock price action hasn't shown us that it's willing to roll over in earnest though.

The metal with PhD. in economics (copper) has given up this week's gains, yet yesterday's lower knot indicates that the bulls have stepped back to a degree. That increases the probability that once trading leaves this flag, they will do so with a break higher.

Summary

Summing up, yesterday's S&P 500 session leaves stocks extended relative to the credit markets, and neither long-dated Treasuries are signalling an immediate turnaround just yet. Much depends upon today's trading in the debt instruments, and I think that the worst of the decline there is past, and that higher prices would follow and help put a floor behind the relatively very extended S&P 500 vs. HYG:SHY.

3rd party Ad. Not an offer or recommendation by Investing.com. See disclosure here or remove ads .

The same goes for the S&P 500 market breadth indicators, where I also see stabilization followed by an upswing in the advance-decline line as the more probable scenario. And that means that the bulls better approach any trading opportunities with tight trade parameters (just as I did throughout many recent sessions), because the air near the February all-time highs is quite thin.

All essays, research and information found above represent analyses and opinions of Monica Kingsley and Sunshine Profits' associates only. As such, it may prove wrong and be subject to change without notice. Opinions and analyses were based on data available to authors of respective essays at the time of writing. Although the information provided above is based on careful research and sources that are believed to be accurate, Monica Kingsley and her associates do not guarantee the accuracy or thoroughness of the data or information reported. The opinions published above are neither an offer nor a recommendation to purchase or sell any securities. Ms. Kingsley is not a Registered Securities Advisor. By reading Monica Kingsley’s reports you fully agree that she will not be held responsible or liable for any decisions you make regarding any information provided in these reports. Investing, trading and speculation in any financial markets may involve high risk of loss. Monica Kingsley, Sunshine Profits' employees and affiliates as well as members of their families may have a short or long position in any securities, including those mentioned in any of the reports or essays, and may make additional purchases and/or sales of those securities without notice.

3rd party Ad. Not an offer or recommendation by Investing.com. See disclosure here or remove ads .

Latest comments

Hey George ..better change glasses because you apparently only see negatives... .there are lots of positives you ignore in your comments. I have previously thanked MK for presenting both sides. You should try that sometimes.
Thank you Randall, this is what objectivity and open mind are about...
Thanks everyone! Let's put the George Pichurov recap straight :) Starting with Treasuries and job market: rising yields lend more credibility to the ever so slowly but surely turning data, such as in the labor market. Tech is holding up great, will go higher, and is becoming ever larger part of the S&P 500 in weight. Should copper go above $3 with comfort, that's another point for the economic recovery. Yes, election uncertainty is starting to ****** but we live under MMT, and stimulus gridlock will be solved one way or the other. Let me be very clear - I am not donning black glasses (or any glasses for that matter). Have a nice rest of the weekend!
 That something is becoming ever larger part of an index is a very comforting thought. Tech will get to 1.618 fib probably though.
 The pace of layoffs is slowing down and continuing claims are also going down for the state programs. You're unfortunately mixing high prices and high yields in corporate bonds vs Treasuries. These are different markets. If prices of Treasuries rise, yields fall. And I have in earlier analyses at selected moments said rising yields mean more credibility to the economic recovery, which is what my tomorrow's article will be about. I have also said that I employ a non-mechanistic view of the markets and clues interpretation - as in, flexible. I also wrote repeatedly that I view V-shaped recovery with high suspicion.
 I have been also telling you that it depends what you do with the knowledge and data at hand. Does it pay to be or did it pay to have been that bearish throughout the upswing and bull market as your posts have been implying, in the bull that I called first in May? Please check first how profitable my calls have actually been, and then take on my synthesis of data and clues, if you still feel it justified and beaten by another approach. Final quote in this comment: stocks love few things more than money printing. I have been hammering the early inflation theme for months too. Look at gold. Go figure what we have...
To recap on Monica optimism. Technical front, oil flat at 35% below pandemic lvls, https://invst.ly/rthls. Credit divergence already 5% since Aug, https://invst.ly/rthls . Insanely overbought tech over 3std.dev. with modest revenue but double cap?! Fundamental front, consumer sentiment index dropped further from June and is 30% below pandemic lvls and stays there, https://www.fxstreet.com/economic-calendar/event/608ffc81-99e8-4b1c-b673-633100761034?timezoneOffset=0. Retail sales July under-performed consensus marking 1.2% instead of 1.9%. These last two important metrics happen while the Communist States of America dump free cash without receipt to almost anybody. Next deal, if any, won't be that fancy. Not at all. Then we have historic aug and sept. drop. Autumn virus wave, a presidential candidate promising corp. tax rise, while TNA money fund (insitutionals) have not declined the least during stonks rise. But, you know, putting that into perspective doesn't really look so bad.
I think I've found the destination for the credit market ETFs. They are all heading for the Point of Control on the volume profile. LQD it's $131.45
The stimulus couldnt crash it. It think it will continue up until a major event.
double top, ready for big short.....hahahahaha.....just.......kidding........hahahahaha!!
 The situation after Friday can be summed up as credit's pace of decline seems to be slowing down, doesn't happen in the vacuum irrespective of Treasuries, and stock resilience is a preview of a likely SPX upswing to come.
 Finally, don't get lost in the outlooks I present. It's the trading strategy, actual calls, the positioning of stop-losses and take-profits, and open trade management, that give meaning to it all. In other words, what you make of all the non-perfectly aligned information out there.
 Finally, my outlooks lay out the big picture. It's the trading strategy, actual calls, the positioning of stop-losses and take-profits, and open trade management, that give meaning to it all. In other words, what you make of all the non-perfectly aligned information out there.
Stimulus package + Vaccine and we will be in a new bull market with all this easy money flying around.
Election could b a black swan.
Thanks again MK....I'm putting a lot of what I'm learning here to work for me!
I will tell you what makes stocks go down people selling them and taking profits
what about flip side..someone is therefore also buying ..and using your theory.. the price go up on a buy?
and what makes bonds go down, profit taking :D ?
very nice!
of course not. Stonks can only go...which way you know.
In the summary, I lay out two good reasons why I expect a bullish resolution. It's about the very short-term - and there I see credit as mostly stabilizing, or close to it at least. I do know what that translates to, and I am happy you do too
 another great red day for credits. Stonks? They live in another galaxy
Risk Disclosure: Trading in financial instruments and/or cryptocurrencies involves high risks including the risk of losing some, or all, of your investment amount, and may not be suitable for all investors. Prices of cryptocurrencies are extremely volatile and may be affected by external factors such as financial, regulatory or political events. Trading on margin increases the financial risks.
Before deciding to trade in financial instrument or cryptocurrencies you should be fully informed of the risks and costs associated with trading the financial markets, carefully consider your investment objectives, level of experience, and risk appetite, and seek professional advice where needed.
Fusion Media would like to remind you that the data contained in this website is not necessarily real-time nor accurate. The data and prices on the website are not necessarily provided by any market or exchange, but may be provided by market makers, and so prices may not be accurate and may differ from the actual price at any given market, meaning prices are indicative and not appropriate for trading purposes. Fusion Media and any provider of the data contained in this website will not accept liability for any loss or damage as a result of your trading, or your reliance on the information contained within this website.
It is prohibited to use, store, reproduce, display, modify, transmit or distribute the data contained in this website without the explicit prior written permission of Fusion Media and/or the data provider. All intellectual property rights are reserved by the providers and/or the exchange providing the data contained in this website.
Fusion Media may be compensated by the advertisers that appear on the website, based on your interaction with the advertisements or advertisers.
© 2007-2024 - Fusion Media Limited. All Rights Reserved.