Get 40% Off
👀 👁 🧿 All eyes on Biogen, up +4,56% after posting earnings. Our AI picked it in March 2024.
Which stocks will surge next?
Unlock AI-picked Stocks

Why You Must Own Silver In 2018

Published 01/22/2018, 12:09 AM
Updated 07/09/2023, 06:31 AM

While Gold is very close to a major breakout (in price), its strength has not filtered down to Silver yet. Gold is 3% away from a major breakout and comfortably above its long-term moving averages. However, Silver is well below its 2016 high and is currently battling its 200-day moving average. But that is okay. Silver typically lags and underperforms Gold until Gold gains momentum or breaks key resistance. A major breakout in Gold this year and its effect on Silver is just one reason why Silver could have a big year.

If and when Silver breaks above its 2017 highs, we can declare its bear market over (in terms of time). The chart below plots all of the major bear markets in Silver. They all end at the point when Silver begins to make higher highs and rises in an impulsive fashion. Silver’s bear market was the second worst by price and potentially the worst in terms of time.
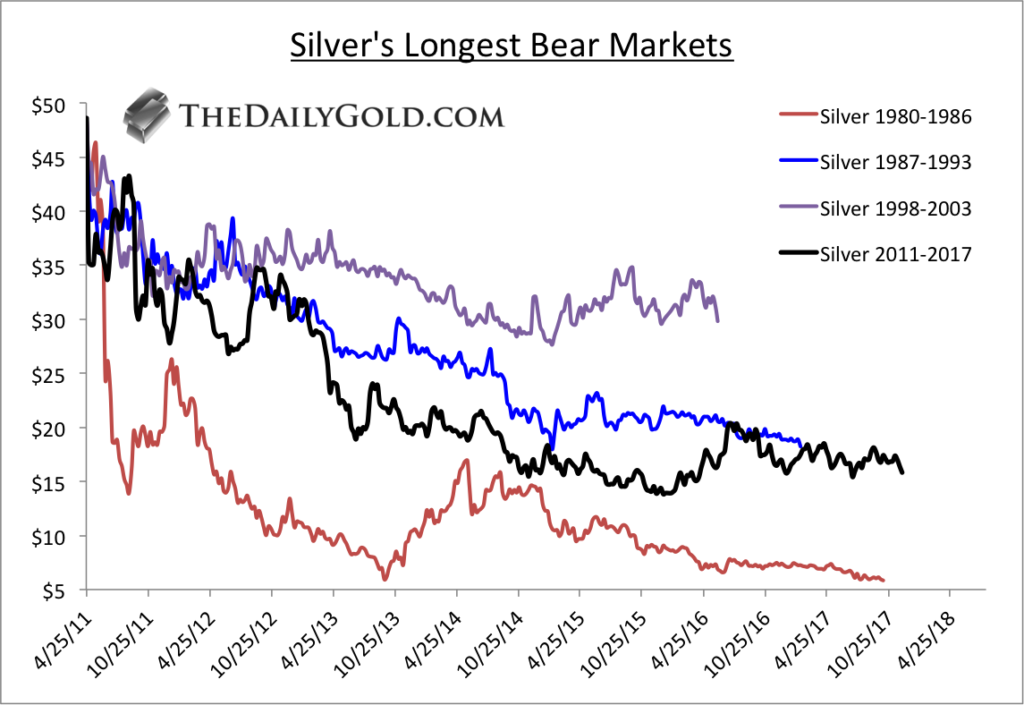
Silver's Longest Bear Markets

The next chart shows the rebounds in Silver from the endpoints in the previous chart. From the three endpoints Silver rebounded significantly in the next 12-15 months. We also included the 2008 crash from which Silver rebounded 100% in the following 13 months.
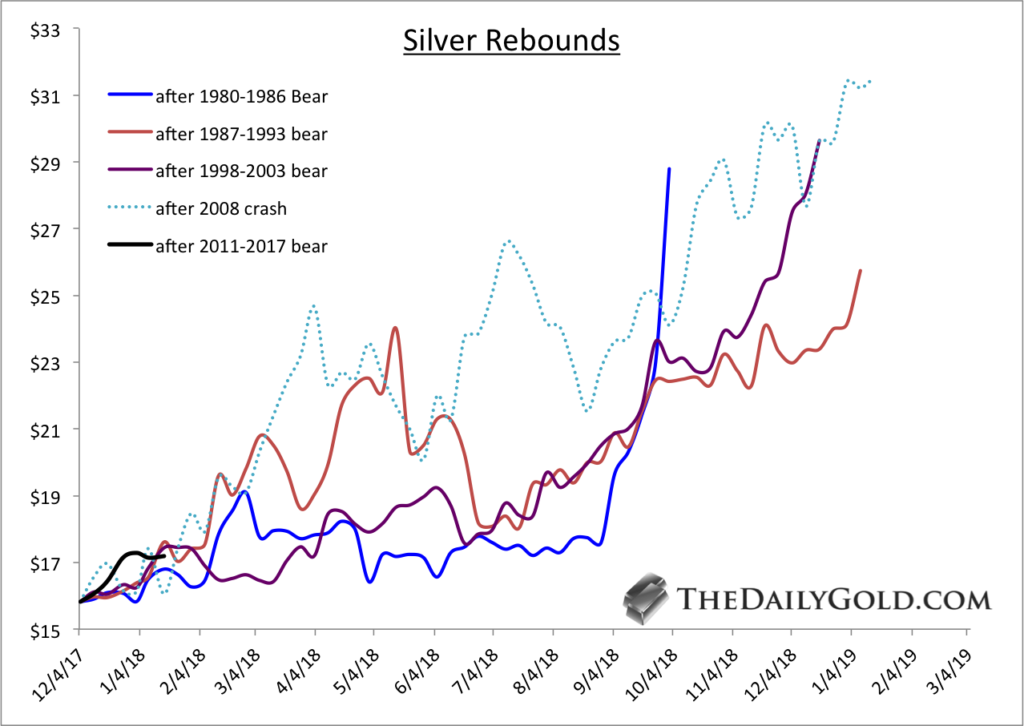
Silver Rebounds

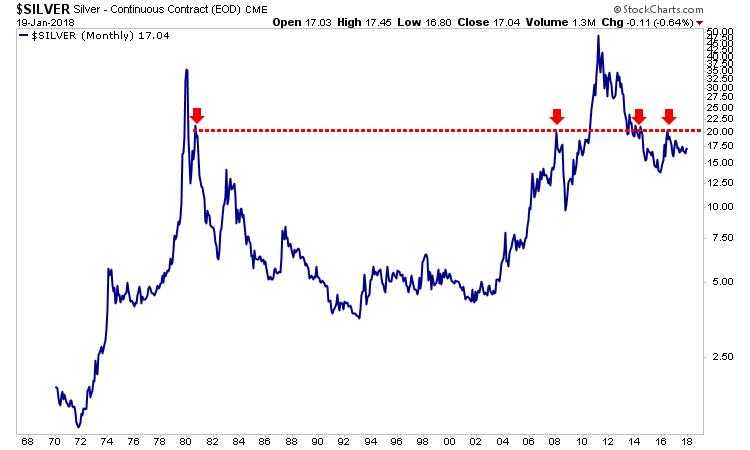
Turning back to the present, we find $20 on a monthly closing basis to be the most significant resistance for Silver. The chart below is a plot of monthly closing prices. It is quite clear that a monthly close above $20 (the 2016 high) could kickstart a good run for Silver.
3rd party Ad. Not an offer or recommendation by Investing.com. See disclosure here or remove ads .

Silver Monthly Chart

Moving from the very long-term to the present, we note that Silver faces initial resistance at trendline 2 as well as the 2017 highs near $18/oz. That stands between Silver at present and the important $20 resistance (which is also shown at trendline 1).
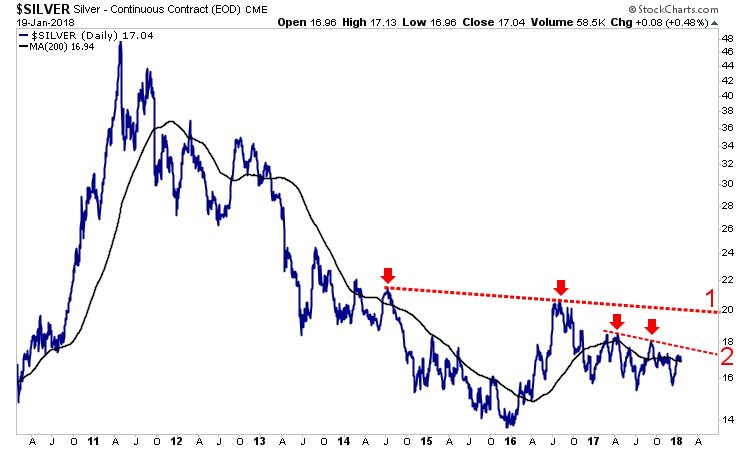
Silver Daily Chart

Silver has often rebounded nearly 100% within 12-15 months after bad and long bear markets. History says Silver is ripe for a similar move over the next 12 to 18 months.

Since Silver follows Gold, a breakout in Gold could be a huge catalyst for Silver to test and break resistance at $20/oz. If that happens, Silver would be on its way to another, typical substantial rebound.

It has happened before and we expect it will happen again. We already own a few juniors with the best silver deposits but we continue to look for junior explorers and silver plays with 5 to 10-fold potential that could benefit from a breakout in precious metals.

Latest comments

i own silver, and have no use for the stuff. there are other reasons folks are reconsidering metals and blockchain however. it's not about any government shutdown which is probably a good thing. nomi prins' book is taking a look and of course the real news, is escaping. the quote "misconfiguration issues related to rollouts" and so forth is now becoming the real issue at hand in the usa. reading this stuff scares me. thinking folks will start turning to metals or whatever they can safely store.
Risk Disclosure: Trading in financial instruments and/or cryptocurrencies involves high risks including the risk of losing some, or all, of your investment amount, and may not be suitable for all investors. Prices of cryptocurrencies are extremely volatile and may be affected by external factors such as financial, regulatory or political events. Trading on margin increases the financial risks.
Before deciding to trade in financial instrument or cryptocurrencies you should be fully informed of the risks and costs associated with trading the financial markets, carefully consider your investment objectives, level of experience, and risk appetite, and seek professional advice where needed.
Fusion Media would like to remind you that the data contained in this website is not necessarily real-time nor accurate. The data and prices on the website are not necessarily provided by any market or exchange, but may be provided by market makers, and so prices may not be accurate and may differ from the actual price at any given market, meaning prices are indicative and not appropriate for trading purposes. Fusion Media and any provider of the data contained in this website will not accept liability for any loss or damage as a result of your trading, or your reliance on the information contained within this website.
It is prohibited to use, store, reproduce, display, modify, transmit or distribute the data contained in this website without the explicit prior written permission of Fusion Media and/or the data provider. All intellectual property rights are reserved by the providers and/or the exchange providing the data contained in this website.
Fusion Media may be compensated by the advertisers that appear on the website, based on your interaction with the advertisements or advertisers.
© 2007-2024 - Fusion Media Limited. All Rights Reserved.