In yesterday's post, I discussed the current correction within the context of previous "bull market" corrections. Specifically, the corrections in 1987, 1998, 2010 and 2011.
However, today, I want to look at the current correction in the context of previous starts to "bear markets" and subsequent recessions.
As I said previously, we never truly know for sure where we are within a given market cycle. This is why it is often fruitless to try and predict future outcomes as you will often be wrong more than right. However, by analyzing past market behavior we can often develop an understanding of what to expect so that appropriate, and timely, reactions can be made.
Currently, the "bulls" are "hopeful" that the worst is now behind us and that the meager rate of economic growth in the U.S. will be enough to sustain the bull market through at least the rest of this year. They could be right, particularly given support by the Federal Reserve of not hiking interest rates in September and potentially discussing more accommodative policy actions if needed. While it has certainly been beneficial over the last few years to give sway to the "bullish" view, it has historically been disastrous to become blinded by it.
From both a fundamental and technical perspective, there is mounting evidence that this correction may not be just a "bump in the bullish road," but rather something more important. While I am not suggesting that we are about to enter into the next great "financial crisis," I am suggesting that investors carrying excess levels of portfolio risk may wind up being rather disappointed.
Fundamentally Speaking
Valuations
As I stated yesterday, earnings growth is deteriorating, and valuation expansion has ceased. As I noted back in June:
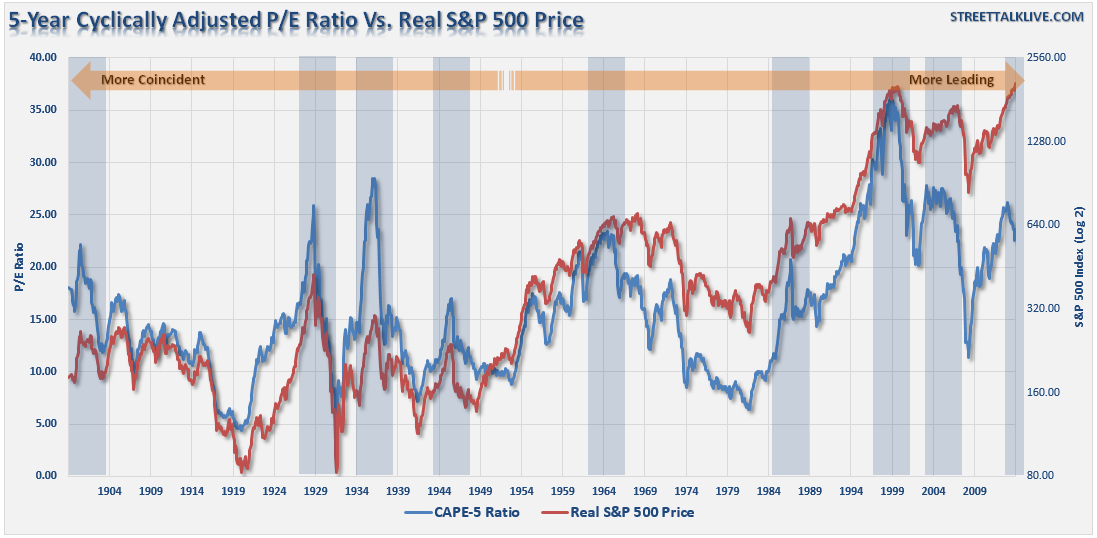
"The need to smooth earnings volatility is necessary to get a better understanding of what the underlying trend of valuations actually is. For investor's periods of 'valuation expansion' are where the bulk of the gains in the financial markets have been made over the last 114 years. History shows, that during periods of 'valuation compression' returns are much more muted and volatile.
Therefore, in order to compensate for the potential 'duration mismatch' of a faster moving market environment, I recalculated the CAPE ratio using a 5-year average as shown in the chart below."
"There is a high correlation between the movements of the CAPE-5 and the S&P 500 index. However, you will notice that prior to 1950 the movements of valuations were more coincident with the overall index as price movement was a primary driver of the valuation metric. As earnings growth began to advance much more quickly post-1950, price movement became less of a dominating factor. Therefore, you can see that the CAPE-5 ratio began to lead overall price changes.
As I stated in yesterday's missive, a key 'warning' for investors, since 1950, has been a decline in the CAPE-5 ratio which has tended to lead price declines in the overall market."
Economic Growth
Just recently the Congressional Budget Office (CBO) revised down its always over-inflated economic forecast. (As an aside, this is the same organization that has never gotten any of its forecasts correct. In 2000, it projected a $1 Trillion budget surplus in 2010 versus a $1 Trillion deficit reality.) To wit:
"Federal budget analysts dropped their estimates for U.S. economic growth after another disappointing first quarter, extending a string of downward revisions to initial forecasts that have been a hallmark of the current expansion.
U.S. gross domestic product is now expected to increase 2% this year, down from a January estimate of 2.9%, the Congressional Budget Office said on Tuesday. The report revised up slightly the GDP forecasts for 2016 to 3.1% from 2.9%, and for 2017 to 2.7% from 2.5%."
Well, at least hope springs eternal at the CBO.
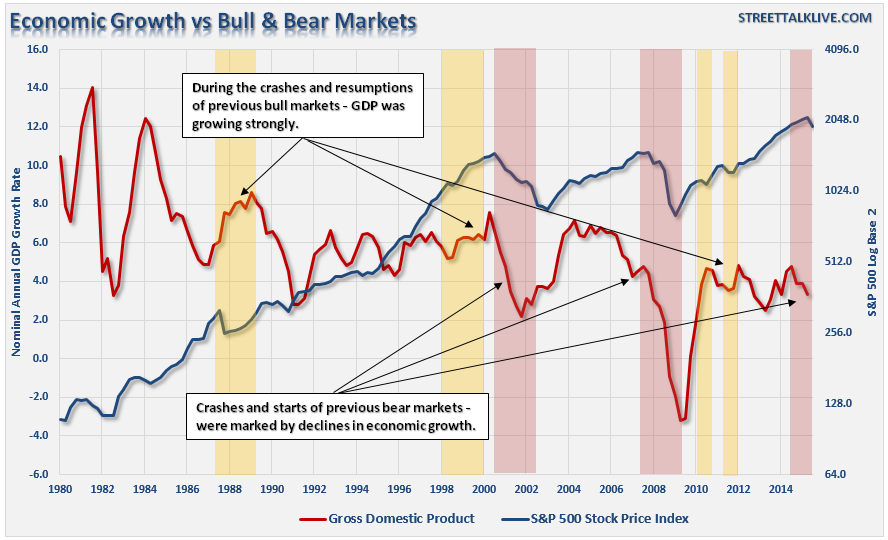
However, the importance of the downward revision to economic growth is that market crashes combined with declining economic growth rates have historically marked the beginning of more substantial bear markets.
Breakeven Inflation Rates
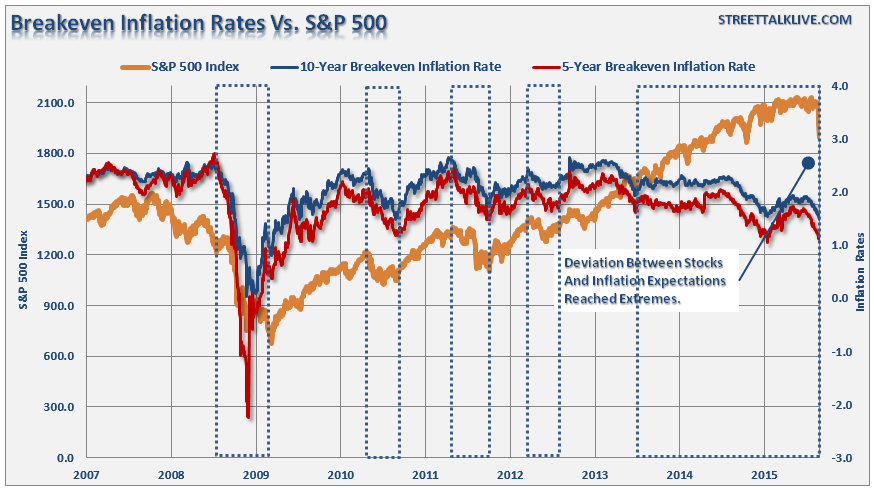
In a strongly growing economy, that would support sustained earnings growth and higher valuations, expectations of rising inflation would be found. There is historically a strong link between inflation expectations and the S&P 500. That was until the start of QE-3 in December of 2012, which flooded the financial markets with liquidity sending asset prices surging without a subsequent pickup in economic growth.
As shown in the chart below, the decline in inflation expectations suggests that the economy is running at a far slower pace than headline statistics suggest. As a consequence, the detachment of the financial markets from economic realities leaves investors at risk of a more substantial correction.
Technically Speaking
From a technical viewpoint, the markets are currently behaving in a manner that has been more closely associated with the beginning of previous bear market declines.
The chart below shows only two moving averages of the S&P 500 index. The short term two-week moving average is in blue as opposed to the one-year moving average in red. Historically, when these two moving averages have crossed it has been representative of a more severe market correction or bear market. This is with the exception of the 2011 correction which was halted by the intervention of the Federal Reserve's second round of quantitative easing.
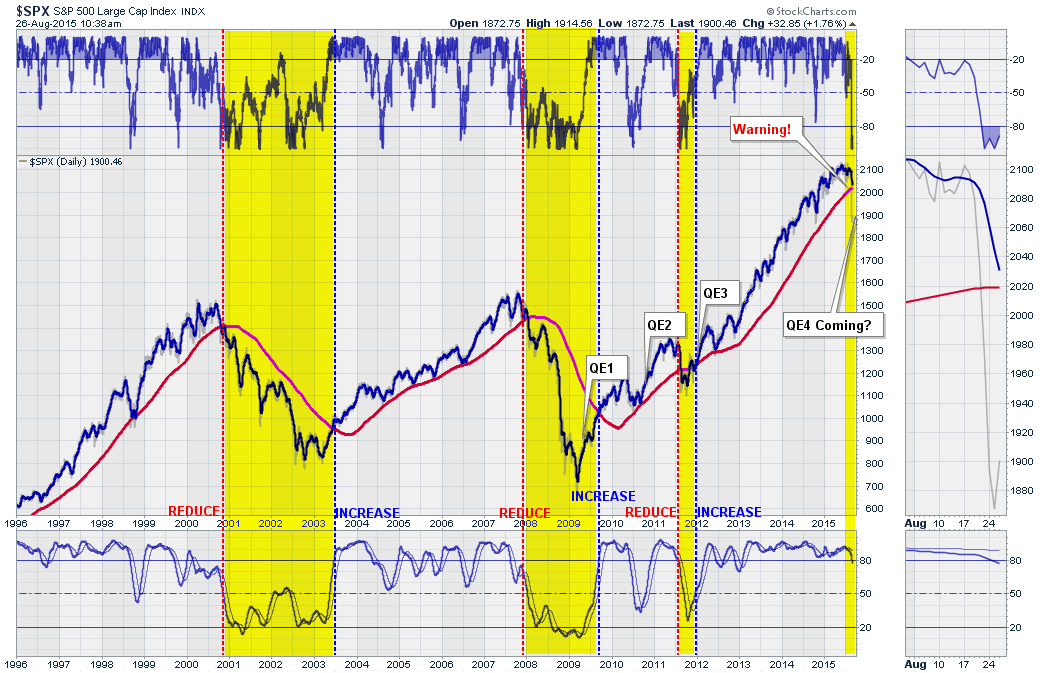
While the moving averages have not crossed as of yet, there WILL do so in the next few days. Very likely, the only thing that would stop a bigger correction from that point would be the onset of another Federal Reserve intervention.
Momentum
As I discussed previously in "Think Like A Bear, Invest Like A Bull:"
"The effect of momentum is arguably one of the most pervasive forces in the financial markets. Throughout history, there are episodes where markets rise, or fall, further and faster than logic would dictate. However, this is the effect of the psychological, or behavioral, forces at work as "greed" and "fear" overtake logical analysis."
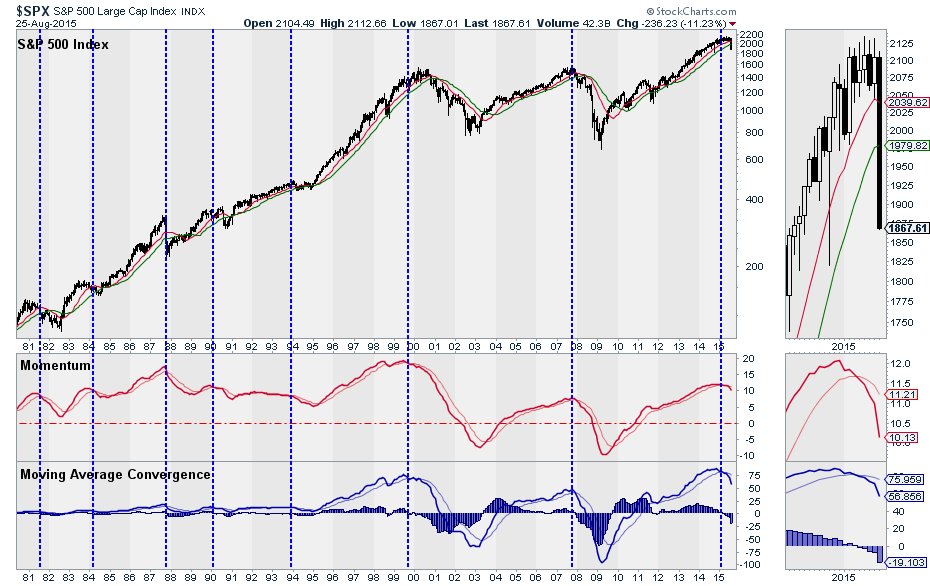
Currently, momentum has clearly broken in the market as shown below. The break in momentum has not only been a good signal to reduce equity risk exposure during bull markets, but also a warning signal of impeding bear markets.
The Elephant In The Room
From both and fundamental and technical viewpoint, there is mounting evidence that the current decline might just be sending a signal that there is more going on here than just an "overdue correction in a bull market." While it is too soon to know for sure, there seems to be little risk in being more conservative within portfolio allocations currently until the market environment clears.
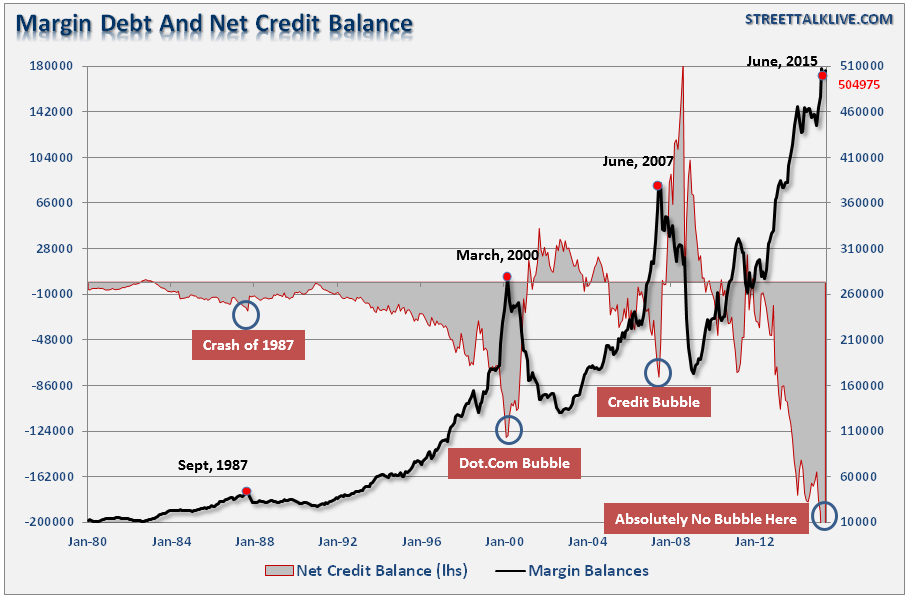
However, the proverbial "elephant" is margin debt. As I stated previously:
"While 'this time could certainly be different,' the reality is that leverage of this magnitude is 'gasoline waiting on a match.' When an event eventually occurs, that creates a rush to sell in the markets, the decline in prices will reach a point that triggers an initial round of margin calls. Since margin debt is a function of the value of the underlying "collateral," the forced sale of assets will reduce the value of the collateral further triggering further margin calls. Those margin calls will trigger more selling forcing more margin calls, so forth and so on.
Notice in the chart that margin debt reductions begins innocently enough before accelerating sharply to the downside."
No one knows for sure where how far the market needs to fall before "margin calls" are triggered. However, if that point is eventually reached, there will be very little investors can do to shield themselves from the decline.
Yes, if you become more conservative now, you might just miss some of the recovery if the market can regain its bullish stance. Of course, it is relatively easy to re-enter the markets when the picture become clearer. However, those that refuse to accept the notion that it is possible the bull market just ended will once again see irreparable damage done to their retirement savings once again.
While it is correct that given enough "time" the markets will eventually recover previous losses, the "time" lost to save, invest and grow funds to meet your retirement goals will not.
Just something to think about.

