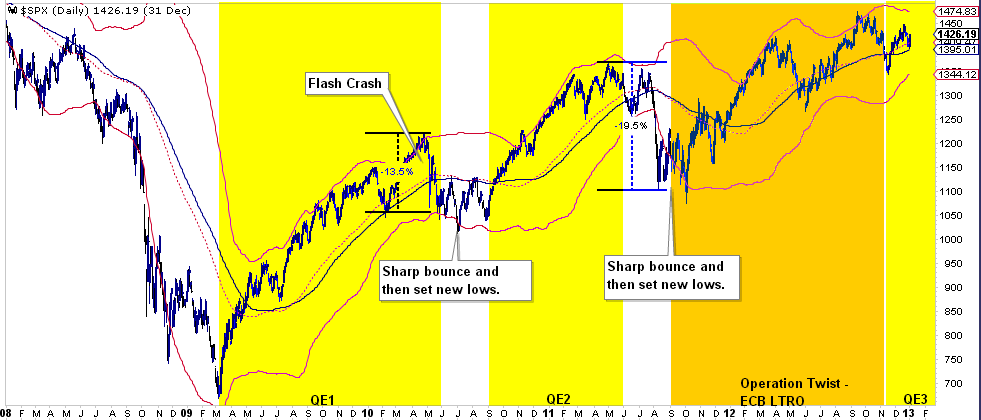
As I discussed yesterday, the now "official correction" was not a surprise. It was something that I have been discussing repeatedly over the last several months. The only surprise was the magnitude of the opening drop.
The question on everyone's mind now is simply whether the correction is over, or is there more to come?
The honest answer is that no one really knows. The bulls are "hoping" that the worst is over and that the current bull market will resume its upward trend. However, there is ample evidence suggesting that something else may be afoot from slowing domestic and international growth, collapsing commodities and falling inflationary pressures.
Furthermore, from a fundamental standpoint, earnings growth is deteriorating, and valuation expansion has ceased. As I addressed in "Shiller's CAPE - Is There A Better Measure:"
"The need to smooth earnings volatility is necessary to get a better understanding of what the underlying trend of valuations actually is. For investor's periods of 'valuation expansion' are where the bulk of the gains in the financial markets have been made over the last 114 years. History shows, that during periods of 'valuation compression' returns are much more muted and volatile.
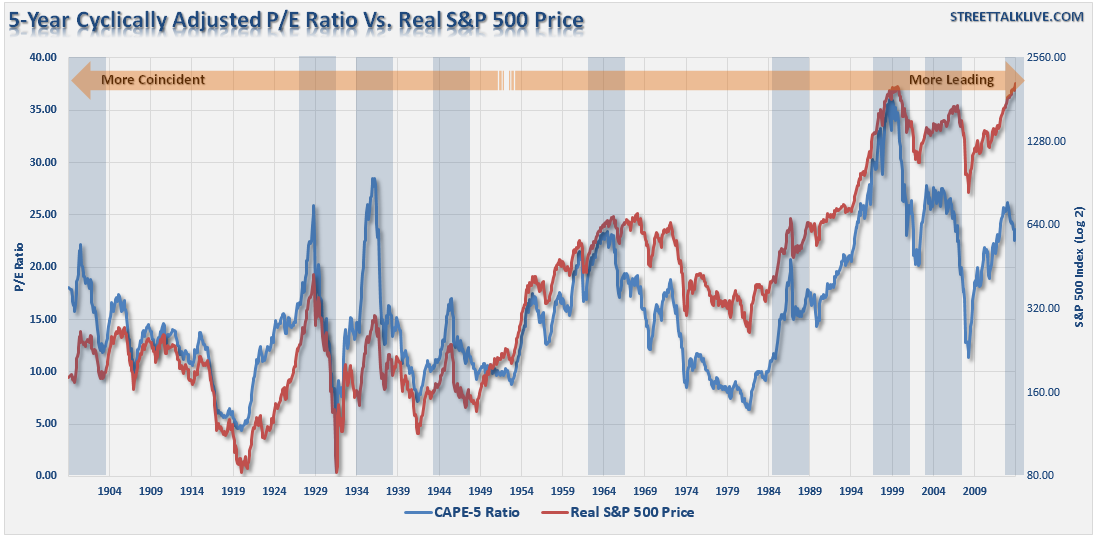
Therefore, in order to compensate for the potential 'duration mismatch' of a faster moving market environment, I recalculated the CAPE ratio using a 5-year average as shown in the chart below."
"There is a high correlation between the movements of the CAPE-5 and the S&P 500 index. However, you will notice that prior to 1950 the movements of valuations were more coincident with the overall index as price movement was a primary driver of the valuation metric. As earnings growth began to advance much more quickly post-1950, price movement became less of a dominating factor. Therefore, you can see that the CAPE-5 ratio began to lead overall price changes.
As I stated in yesterday's missive, a key 'warning' for investors, since 1950, has been a decline in the CAPE-5 ratio which has tended to lead price declines in the overall market."
Yes, I know...low interest rates, Central Bank interventions, etc., etc. have changed all that and "this time is different." Let me assure its not. Unfortunately, the truth of that statement will only be recognized after a great deal of pain.
But that is a longer term dynamic that will take some time to play out and does not answer the immediate question about whether the current correction is over.
In such a short time-frame fundamentals and economics are of relatively little value. So we really must focus our analysis on price dynamics.
As I addressed in this past weekend's newsletter:
"The time has now come to start moving more heavily to cash. As I will discuss throughout this weekend's missive, including the 401k-Plan Manager, it is now time to 'OPPORTUNISTICALLY' REDUCE PORTFOLIO ALLOCATIONS.
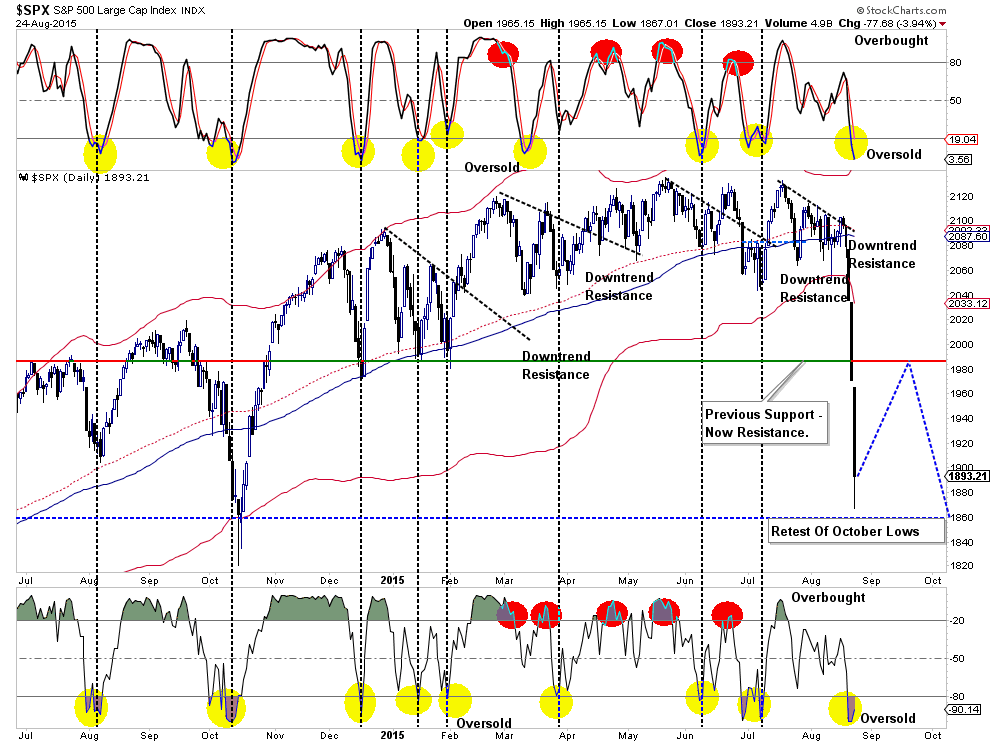
As noted in the chart below, the markets are now once again extremely oversold."
"As I have often stated in the past, by the time a market signal is given in the market, the markets are very likely at a point of extreme oversold or bought conditions. Therefore, it is always better to use the subsequent relaxation of those extreme conditions to add or reduce portfolio exposure.
This is why it is never a good idea to 'panic' when something initially goes wrong. With the markets now deeply oversold, it is VERY likely that the markets will bounce next week. The problem, for those with 'buy and hold' bullishly biased strategies, is the 'bull market' has now ended...at least for now.
As shown in the chart above, the bounce from these oversold levels will run into a substantial amount of overhead resistance where the rally will very likely fail. THIS WILL BE THE POINT to take some actions to rebalance/reduce portfolio equity risk as needed.
Important Note: I am NOT suggesting that one liquidate all holdings and go solely to cash. However, I am suggesting that if the recent market decline sent shockwaves through your nervous system, you likely have an excessive amount of "risk" in your portfolio. It is also just good portfolio management to take profits from winners (let winner's run) and sell laggards (cut losers short.)
To put a post-crash rally into perspective, let's take a look some previous crashes to see "what happened next."
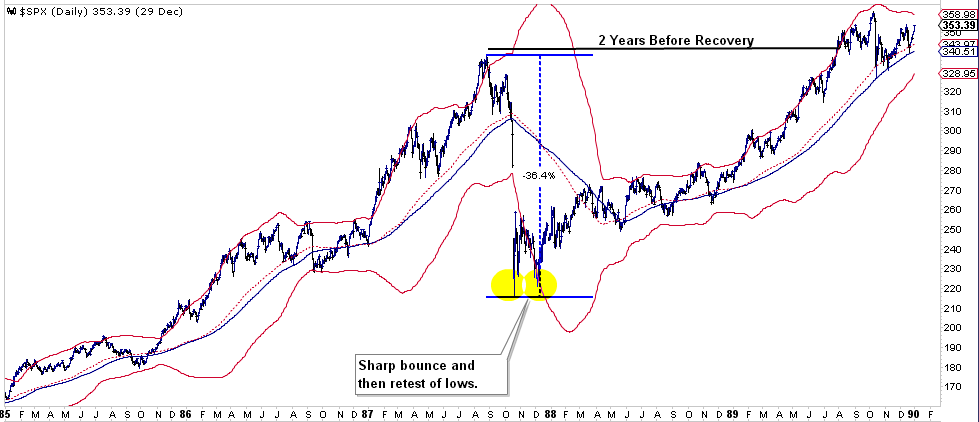
1987
After the initial crash in 1987, a 36.4% drop from the peak, the markets immediately bounced back to previous resistance levels, and the began a more normalized decline back to the previous lows.
This is not surprising as investors caught in the initial plunge are "psychologically traumatized" and look for an opportunity to flee to safety. The subsequent two-year recovery back to old highs became more volatile.
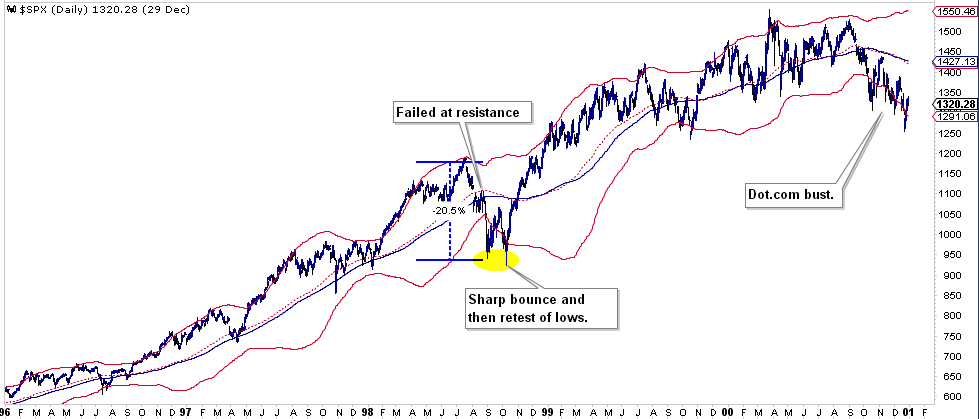
1998
Very similarly, the crash in 1998, spurred by the "Russian Debt Default", consisted of a 20%+ dive from the previous peak only to find support at the lows from the beginning of the year.
The initial bounce from the lows failed once again, as investors fled for the "safety" of cash, and new lows were found.
2010 and 2011
While the media has been pointing out the similarities of Monday's 1089-point plunge to the May, 2010 "flash crash;" the 2011 "debt ceiling debate" crash is also worth noting.
As noted, in both cases the markets suffered substantial declines to test previous support levels. The difference this time was that the declines were halted by the Federal Reserve's monetary interventions. However, importantly, in both cases, the initial decline led to a sharp bounce before the markets then set new lows.
There Is A Difference
In all cases above, valuations were in expansion mode as shown in the 5-year CAPE ratio above. The difference this time is that valuations are contracting which is more historically coincident with the onset of much deeper reversions.
The sharp "reflexive" rally that will occur this week is likely the opportunity to review portfolio holdings and make adjustments before the next decline. History clearly suggests that reflexive rallies are prone to failing and a retest of lows is common. Again, I am not talking about making wholesale liquidations in accounts. However, I am suggesting taking prudent portfolio management actions to raise some cash and reduce overall portfolio risk.
If the next decline finds support within the confines of the ongoing bull market, equity risk can simply be increased. The penalty for being underexposed initially will be minor within the context of the broader trend.
However, if the six-year bull market did indeed just conclude for now, you will be thankful for having a bit of extra cash in coffers.

