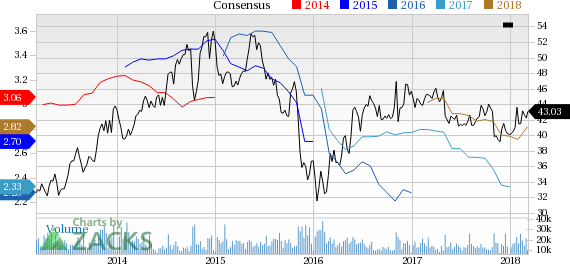
It has been about a month since the last earnings report for Archer Daniels Midland Company (NYSE:ADM) . Shares have added about 2% in that time frame.
Will the recent positive trend continue leading up to its next earnings release, or is ADM due for a pullback? Before we dive into how investors and analysts have reacted as of late, let's take a quick look at the most recent earnings report in order to get a better handle on the important drivers.
Archer Daniels Q4 Earnings Top Estimates, Revenues Lag
Archer Daniels reported mixed fourth-quarter 2017 results. The company’s fourth-quarter adjusted earnings of 82 cents per share increased 9.3% year over year and also outpaced the Zacks Consensus Estimate of 70 cents. On a reported basis, Archer Daniels’ earnings were $1.39 per share compared with 73 cents in the prior-year quarter.
However, total revenues of $16,070 million declined 2.6% year over year on lower sales across most of its segments. The top line missed the Zacks Consensus Estimate of $16,350 million as well, thus continuing with its miserable surprise trend.
Going by segments, quarterly revenues at Archer Daniels’ Agricultural Services segment were down 6.8% year over year to $7,517 million, the Corn Processing segment’s revenues dipped 0.3% to $2,509 million and the Wild Flavors and Specialty Ingredients segment’s revenues fell 3.3% to $526 million. Conversely, the Oilseeds Processing segment's revenues grew 2.7% to $5,424 million, while revenues at the Other division remained flat at $94 million.
Operational Discussion
Archer Daniels reported adjusted segment operating profit of $793 million in fourth-quarter 2017, down 4.1% from the year-ago quarter. On a GAAP basis, the company’s segment operating profit declined 9.1% year over year to $733 million.
On a segmental adjusted basis, adjusted operating profit for the Agricultural Services segment climbed 22.9% to $301 million owing to robust merchandising and handling results. The improvement was also fueled by sturdy performance in Global Trade, solid destination marketing gains as well as insurance and other income, which somewhat compensated the lack of competitiveness of U.S. grain exports. While, Milling and Other operations were weak due to reduced volumes and soft margins, Transportation results were impacted by diminished barge loadings as well as freight values.
Archer Daniels' Corn Processing segment’s adjusted operating profit improved 2.4% to $261 million. Results benefited from enhanced results at both North America, and EMEA Sweeteners and Starches. However, Bioproducts results were hurt by soft ethanol margins partly offset by favorable risk management.
The Oilseeds Processing segment’s adjusted operating profit decreased 15.5% year over year to $202 million. In spite of robust crush volumes and persistent growth in demand, results were hurt by soft crush margins as well as lower South American origination margins. Together, these factors hampered Crushing and Origination results. Additionally, soft biodiesel results hurt Refining, Packaging, Biodiesel and Other operations. However, the decline was somewhat mitigated by sturdy refining and packaging results. Further, results in Asia continued to gain from Wilmar’s contributions.
The Wild Flavors and Specialty Ingredients segment’s adjusted operating profit surged 47.4% to $56 million owing to double-digit rise in WILD Flavors’ operating profit driven by soli sales in all regions. Also, the results at the Specialty Ingredients division witnessed a year-over-year growth.
Financials
Archer Daniels ended the quarter with $804 million in cash and cash equivalents. As of Dec 31, 2017, long-term debt including current maturities was $6,636 million. Shareholders’ equity at quarter end was $18,322 million.
In 2017, Archer Daniels generated $2,211 million of cash from operating activities. Further, the company’s trailing four-quarter average adjusted ROIC came in at 6.4%.
Additionally, the company returned $1.5 billion to shareholders in 2017, in the form of share repurchases and dividend payments, remaining well on track with its balanced capital allocation plan.
Concurrent to this earnings release, management has declared a dividend hike of 4.7% to 33.5 cents per share compared with prior payout of 32 cents. The new dividend is payable on Mar 13, 2018, to shareholders of record as on Feb 20.
Looking Ahead
Management remains pleased with its results, supported by cost and capital initiatives, earnings per share growth and increased returns. Going into 2018, Archer Daniels remains encouraged to deliver growth through its strategic initiatives like increasing capabilities, product innovations, maximizing shareholders’ value and solid international foothold.
How Have Estimates Been Moving Since Then?
In the past month, investors have witnessed an upward trend in fresh estimates. There have been two revisions higher for the current quarter compared to one lower.
VGM Scores
At this time, ADM has a subpar Growth Score of D, however its Momentum is doing a lot better with a B. Following the exact same course, the stock was allocated a grade of B on the value side, putting it in the top 40% for this investment strategy.
Overall, the stock has an aggregate VGM Score of B. If you aren't focused on one strategy, this score is the one you should be interested in.
Zacks' style scores indicate that the company's stock is suitable for value and momentum investors.
Outlook
Estimates have been broadly trending upward for the stock, and the magnitude of these revisions looks promising. Notably, ADM has a Zacks Rank #3 (Hold). We expect an in-line return from the stock in the next few months.
Archer Daniels Midland Company (ADM): Free Stock Analysis Report
Original post
Zacks Investment Research

