The announcement Friday that in addition to the already historically high balance sheet the Fed has created, they agreed to purchase $1 trillion dollars in repos every day until the end of March.
What impact is this having on the credit, equities and commodities markets?

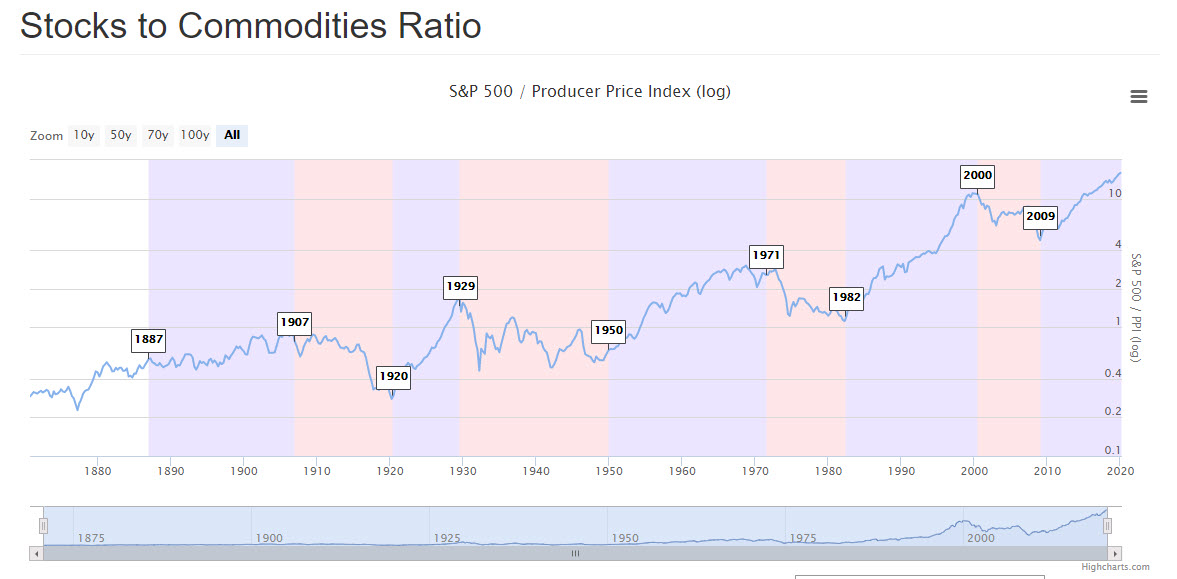
This chart measures the S&P 500 relative to the commodity market index PPI (Producer Price Index). When the ratio rises stocks beat commodity returns and when it falls commodities beat stock returns.
During periods of deflation, stocks and commodities are often both in bear markets, while commodities do better than stocks. These periods are followed by inflation, including inflationary events such as the Gold nationalization of 1934, the Nixon shock of 1971, and war (WW1, WW2, Vietnam, Iraq). Commodities well outperform stocks during inflationary times.
In 2020, with deflation on the tongues of many economists, there are a few of us like me, an armchair economist, that think we are more likely to see a stagflation period.
Some facts:
The S&P 500, after an 11-year run of growth, closed Friday under the 80-month moving average signaling the end of growth vis a vis the typical 5-7-year business cycle.
Gold has well outperformed the SPY, and even though it’s under pressure, it continues to outperform.
The amount of cash stimulus globally, combined with growing food demand and supply chain disruptions means countries can buy up the diminishing raw materials with borrowed money at low rates. That’s despite the US dollar, which is historically strong.
Friday, the Ag Fund ETF DBA, coffee and sugar all closed green.
Silver, at a historical 80 year low against gold, narrowed that ratio closing up 3% versus gold up 2%.
Silver also rose 3% in the face of SPY which closed down nearly 5%
High Yield Investment Grade Bonds (NYSE:LQD), broke down to 2010 lows.
Given that the 2020 crisis, although it looks different than the Nixon shock of 1971, or the wars (WW1, WW2, Vietnam, Iraq), we have a new crisis, or really a slew of them.
This suggests a very high probability we will see the PPI rise, while the SPY continues to decline.
S&P 500 (SPY) The low 228.02 from 3/18 held marginally-now key
Russell 2000 (IWM) Until this clears 110-noise. Under 95.69 another leg down
Dow (DIA) 3/18 low 189.67 held marginally-now key
Nasdaq (QQQ) 166.80 the 3/18 low is critical
KRE (Regional Banks) 29.22 key support
SMH (Semiconductors) 96.00 key to hold
IYT (Transportation) 116.61 key support with 135 resistance
IBB (Biotechnology) 102.35 resistance and 92.15 recent low
XRT (Retail) 26.40 recent low-a 2010 low
Volatility Index (VXX) Bounced off the 50.00 level support-over 65 should continue higher
Junk Bonds (JNK) New lows for the year
LQD (iShs iBoxx High yield Bonds) 99.21 was the last low in 2010 (on the 50-WMA) before this took off for the last 10 years.
