Let's focus on fundamentals and step back from the angst over the Ukraine and Crimea, which is likely to dissipate soon because neither Europe nor the United States has shown any appetite for military intervention that would really freak out the markets. Let me put it very simply. Stock prices go up for only two basic fundamental reasons:
- Rising earnings, otherwise known as cyclical expansion; or
- Falling discount rate, otherwise known as P/E expansion.
As the SPX rallied to all-time highs late last week, it's important to understand the fundamental drivers behind the equity rally. The resolution of the fundamental driver question has strong implications on the robustness (or fragility) of the current surge in stock prices.
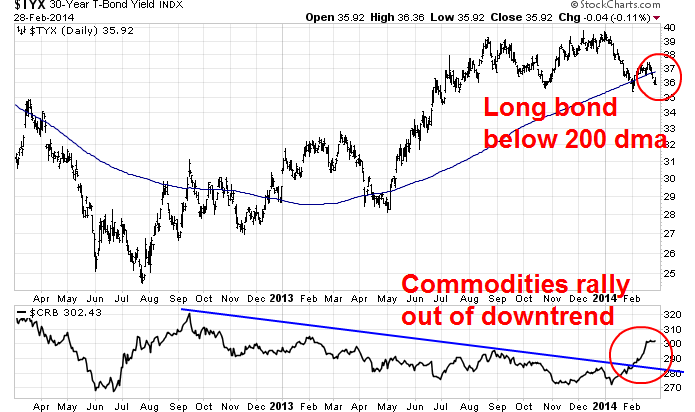
Here is the conundrum. Commodity prices, which are a proxy for the cyclical expansion case, and bond prices, which are a proxy of the lower discount rate and P/E expansion explanation, have both staged rallies. As the chart below shows, long bond rates have fallen below their 200 day moving average, while commodity prices, as measured by the CRB Index, have rallied out of a multi-year downtrend.
The rallies in these two asset classes are contradictory. Commodity prices tend to rise because of higher inflationary expectations, presumably from cyclically driven growth, while bond prices thrive in a deflationary environment.
What's going on?
There could be a simple explanation for tactical rallies in these asset classes - excessively bearish sentiment. Analysts like
The Short Side of Long have shown that both bonds and commodities are hated and under-owned by institutions and hedge funds. Could the strength just be snap-back rallies from deeply oversold conditions? If so, which rally is the real one?
3rd party Ad. Not an offer or recommendation by Investing.com. See disclosure
here or
remove ads
.
The P/E expansion case
I could argue both sides. The falling interest rate/lower discount rate/P/E expansion case is well supported. While the cyclical bulls could argue that the chart above of the long bond yield and the CRB Index shows the fall in interest rates to be quite muted compared to the more robust technical underpinnings of the CRB rally through the downtrend, a deeper examination of the charts tells a slightly different story.
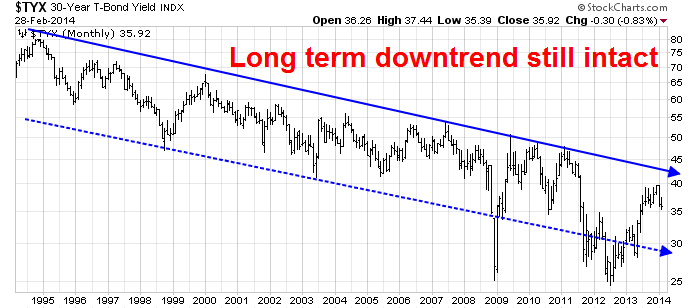
First of all, a 20-year chart of long bond rates shows that they remain in a secular downtrend. It could be argued that the market got overly enthusiastic in 2008 and in 2011-2013, but the downtrend in long rates remain intact.
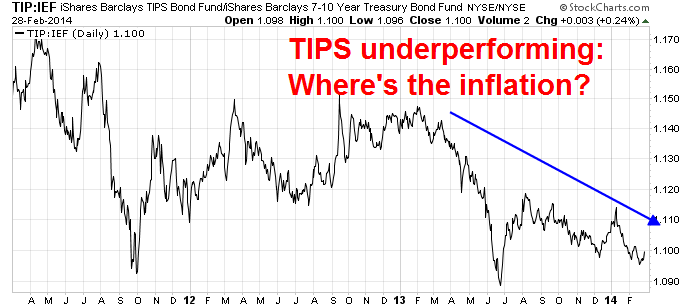
What's more, TIPS have been underperforming 7-10 year Treasuries for about a year, indicating that inflationary expectations remain under control and therefore the commodity rally isn't "real". (The counterargument is TIPS measure CPI inflation while commodities measure asset inflation, which are two different animals.)
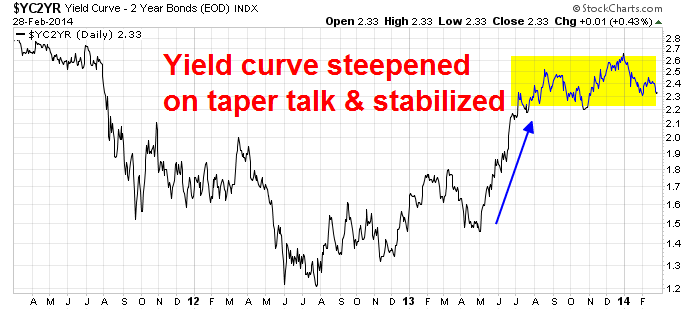
Another measure of inflationary and growth expectations is the shape of the yield curve. The 2/10 yield curve steepened last May in response to Bernanke's taper talk, but it has largely stabilized since then. If inflationary and growth expectations were truly rising, shouldn't the yield curve be steepening in the same way commodity prices are rallying?
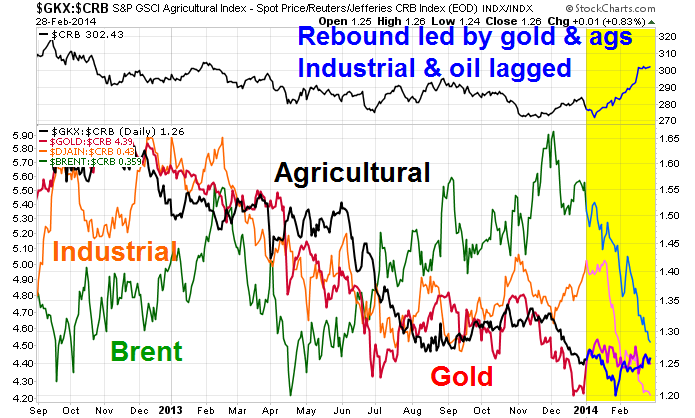
If you dive into what's behind the recent rise in the CRB Index (top panel on chart below), you will find that the rally was driven by gold and agricultural commodities (bottom panel, chart below), whose ascent can largely be explained by weather and supply conditions. The more cyclically sensitive commodities such as energy and industrial metals underperformed the CRB during this rally.
3rd party Ad. Not an offer or recommendation by Investing.com. See disclosure
here or
remove ads
.
The cyclical recovery case
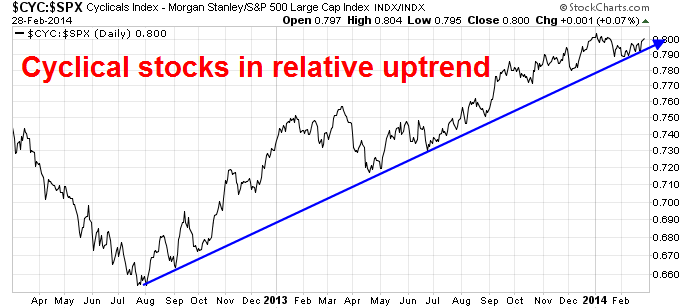
The P/E expansion case is driven mainly by the message from the bond market. What I find interesting is that the equity market is telling a slightly different story of a cyclical expansion. First and foremost, cyclical stocks continue to lead US equities higher. The chart below, of the relative performance of the Morgan Stanley Cyclical Index against the market, shows that cyclical stocks remain in a relative uptrend that began in August 2012.
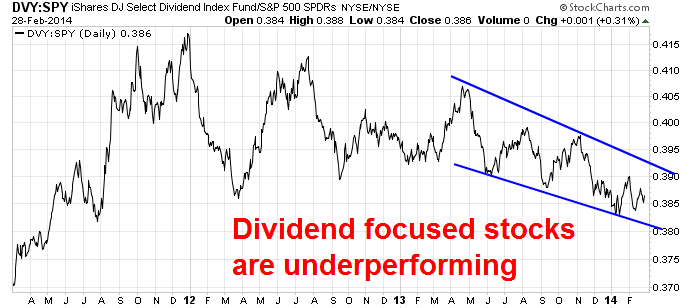
What's more, dividend paying stocks, which are more interest sensitive, are underperforming the broader market. In a debate over the relative magnitude of the cyclical vs. falling interest rate effects, this chart suggests that the cyclical effects are stronger than the interest rate, or P/E expansion, effect.
While it is true that current conditions in commodity prices are mainly agricultural driven, outside of the ags, gold and precious metals have rallied. But a rally in gold is too narrow a leadership to be sustainable for asset inflationary expectations to rise. The cyclically sensitive sectors like Materials and Energy are behaving well on a relative basis.
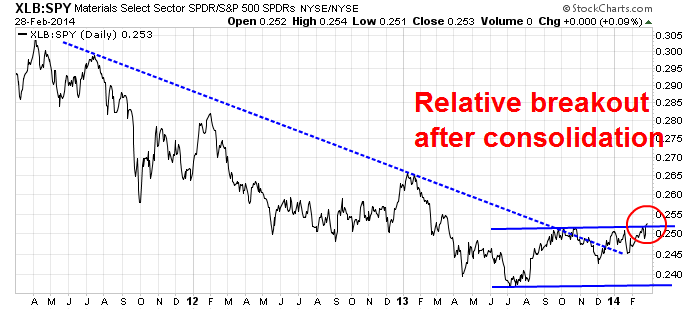
Take a look at this relative performance chart of the Materials sector. Materials rallied out of a multi-year relative downtrend, consolidated and staged a relative breakout last week. Could the underlying commodities be that far behind?
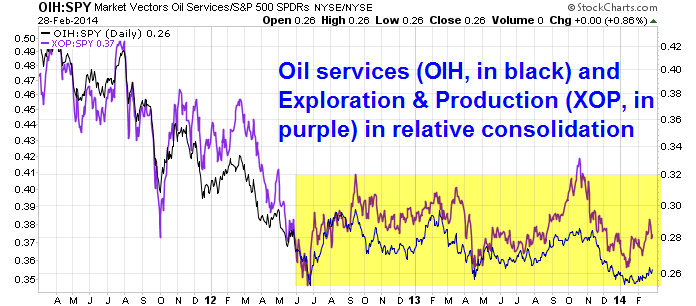
The picture in energy is less bullish but remains constructive. Both the oil services and exploration and production company groups have rallied out of relative downtrends, just like Materials, and remain in relative consolidation phases. If they follow the pattern of the Materials sector, it will only be a matter of time before they break out to the upside in relative terms.
3rd party Ad. Not an offer or recommendation by Investing.com. See disclosure
here or
remove ads
.
Cyclical growth or P/E expansion?
As I said, the resolution of these explanations for the stock market rally has important implications for the longevity of the rally. A growth based explanation is more robust in that it suggests that US economic growth is accelerating and therefore sales and profits will expand. On the other hand, a rally based on P/E expansion and rising growth expectations which may not materialize is a more vulnerable to disappointment.
What's the answer?
I honestly don't know. Based on my analysis, I am slightly more partial to the cyclical expansion explanation, as the P/E expansion case is more based on current conditions (gold and agricultural commodities rising), while stock market internals are more supportive of the cyclical expansion case. I will admit, however, that respect has to be accorded to the message of the bond market.
In his weekly comment on high frequency economic releases,
New Deal Democrat wrote that his latest reading is uncertain whether the current bout of economic weakness is just weather related or if it could a sign of a more fundamental slowdown in economic momentum [emphasis added]:
Last year's weakness in the long leading indicators appears to have now shown up in the short leading indicators. Temporary jobs, initial jobless claims, gas, oil and other commodities were all close to neutral again this week.
The coincident reports were also very mixed. Both consumer spending and tax withholding were positive, but faded with no obvious weather excuse. Shipping was mixed. Steel production was negative. YoY comparisons of gas usage are negative again. On the other hand, rail traffic was strong this week, the mirror image of last week.
The weakness that spread throughout the short leading and coincident indicators with few exceptions in the last couple of weeks abated somewhat, but is only weakly positive. It remains critical to see whether or not the recent weakness continues after the winter weather breaks.
3rd party Ad. Not an offer or recommendation by Investing.com. See disclosure
here or
remove ads
.
Until this debate is resolved, the longevity and vulnerability of the equity market rally remains in the air.
Disclosure: Cam Hui is a portfolio manager at Qwest Investment Fund Management Ltd. (“Qwest”). The opinions and any recommendations expressed in the blog are those of the author and do not reflect the opinions and recommendations of Qwest. Qwest reviews Mr. Hui’s blog to ensure it is connected with Mr. Hui’s obligation to deal fairly, honestly and in good faith with the blog’s readers.”
None of the information or opinions expressed in this blog constitutes a solicitation for the purchase or sale of any security or other instrument. Nothing in this blog constitutes investment advice and any recommendations that may be contained herein have not been based upon a consideration of the investment objectives, financial situation or particular needs of any specific recipient. Any purchase or sale activity in any securities or other instrument should be based upon your own analysis and conclusions. Past performance is not indicative of future results. Either Qwest or I may hold or control long or short positions in the securities or instruments mentioned.
