By now it is clear that we are in the throes of a historic market sell off. Money is flying off the table at a record-breaking pace and it's affecting everything from stocks to bonds to commodities to cryptos.
One of my colleagues asked a really smart question yesterday: if everything is selling off, where is the money actually going?
We know that in most major market sell-offs, other assets tend to rise in relation.Gold is usually a benefactor as it is seen as a safe haven and hedge. Many times the US dollar and the Japanese yen will rise as stock investors move to hold cash.
In this case, everything is just falling. The answer is that it doesn't go anywhere, it simply disappears.
Let's think about Market Cap. This metric is calculated by multiplying the total number of shares by the current value. So, if Apple (NASDAQ:AAPL) is worth $180 per share and there are 5 billion shares, we get to a market cap of $900 billions. ($180 X 5 billions)
Here's the fun part. Let's say there are only two people on the floor of the NYSE today and one person wants to sell his shares but the other guy doesn't want to buy. The seller will have to keep lowering his price until the buyer agrees to pay for it. If the price they place the trade is $160, then that becomes the market price.
We then adjust the entire Market Cap to incorporate the current price to ($160 X 5 billions) $800 billions. Boom!
With one trade, everybody holding Apple lost money and the company itself lost $100 billions worth of value.
Now, between you and me, some of the most successful investors in history have gotten their start in the markets just after a huge crash. So, for those of you who are just thinking about getting in, maybe not right now but very soon, we will likely see the best buying opportunities in decades.
Today's Highlights
Global Multi-asset Sell-off
Please note: All data, figures & graphs are valid as of February 6th. All trading carries risk. Only risk capital you can afford to lose.
Volatility Spike
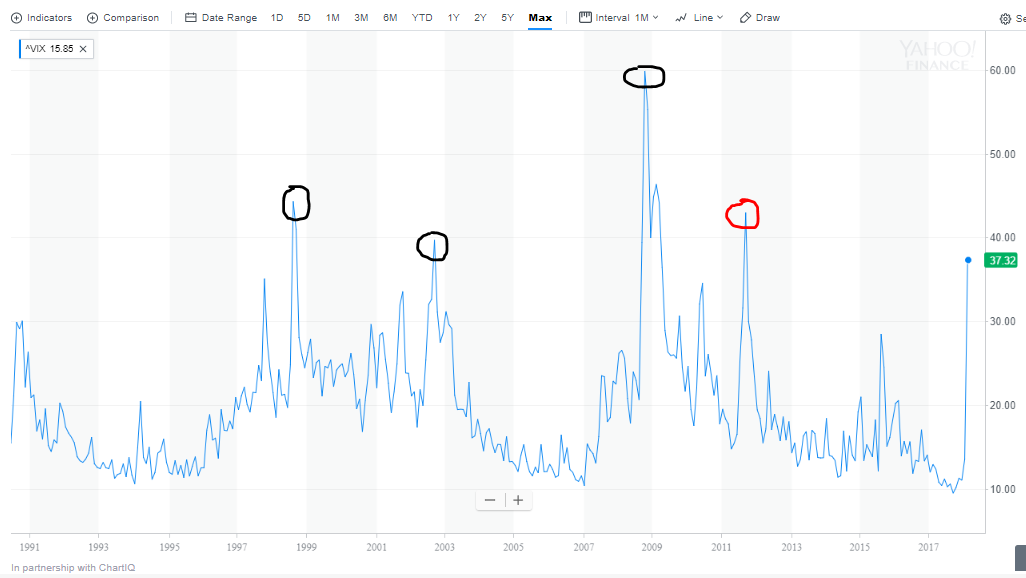
We looked at this chart yesterday but already need to check it again as the level of the VIX Volatility Index (AKA the fear gauge) has nearly doubled in the last 24 hours.
In fact, this index has only ever been higher than it is now four times since it was created.

I would like to call your attention to the previous spike (red circle), which occurred in August of 2011. Some will recall that this was the sell-off related to the European debt crisis with Greece, Italy, and Spain dragging down the French and German economies.
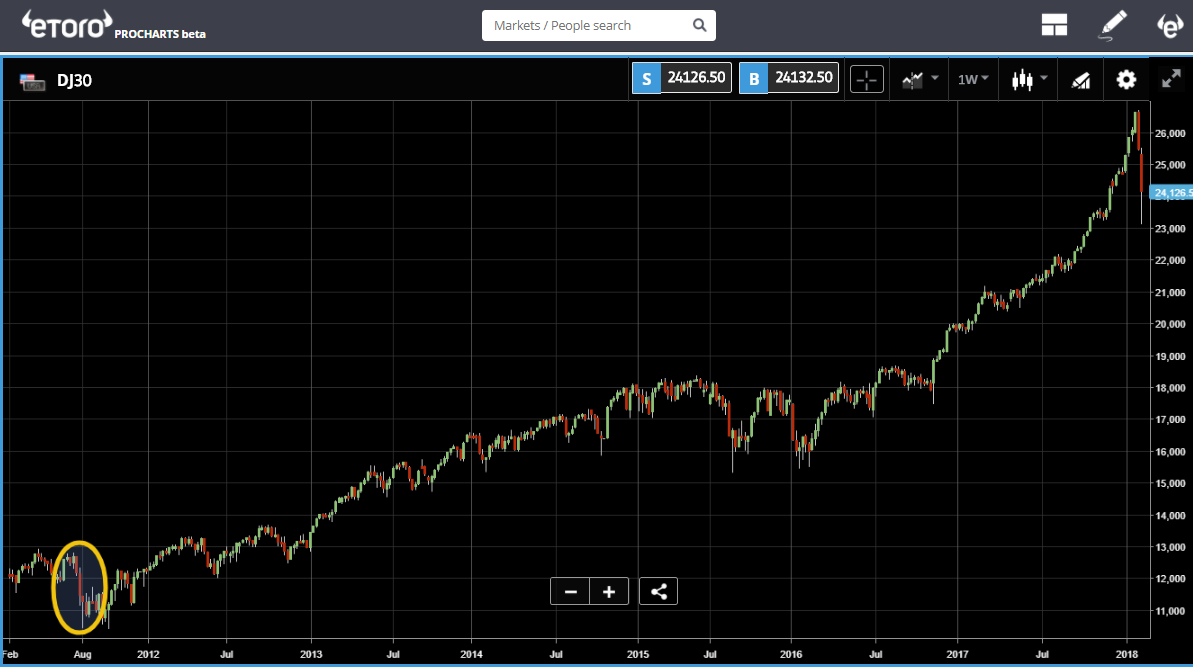
Here you can see the effects of that sell off (yellow circle) in the Dow Jones.

As you can see, the Dow's plunge over the last two trading sessions is already worse than that. If not in percentage value, then certainly by number of points shed.
Why is this happening?
Well, nobody has really figured it out just yet. However, we can look at where it all started to get some clues.
As we noted on January 10th, there was a sudden spike in bond yields that caused some concern in the stock markets.
Furthermore, the rally driven by selling pressure intensified last Friday after the US government reported that the job market was much stronger than expected.
The running theory is that a stronger economy could spur mega-inflation in the US. Let's not forget that the Federal Reserve has created $4.5 trillions worth of money over the last decade, and has essentially pumped the system full of money.
Back when it started the quantitative easing program in 2009, there were concerns that all this money creation would eventually lead to large-scale inflation and asset bubbles. So now this is simply playing out.
What about Gold?
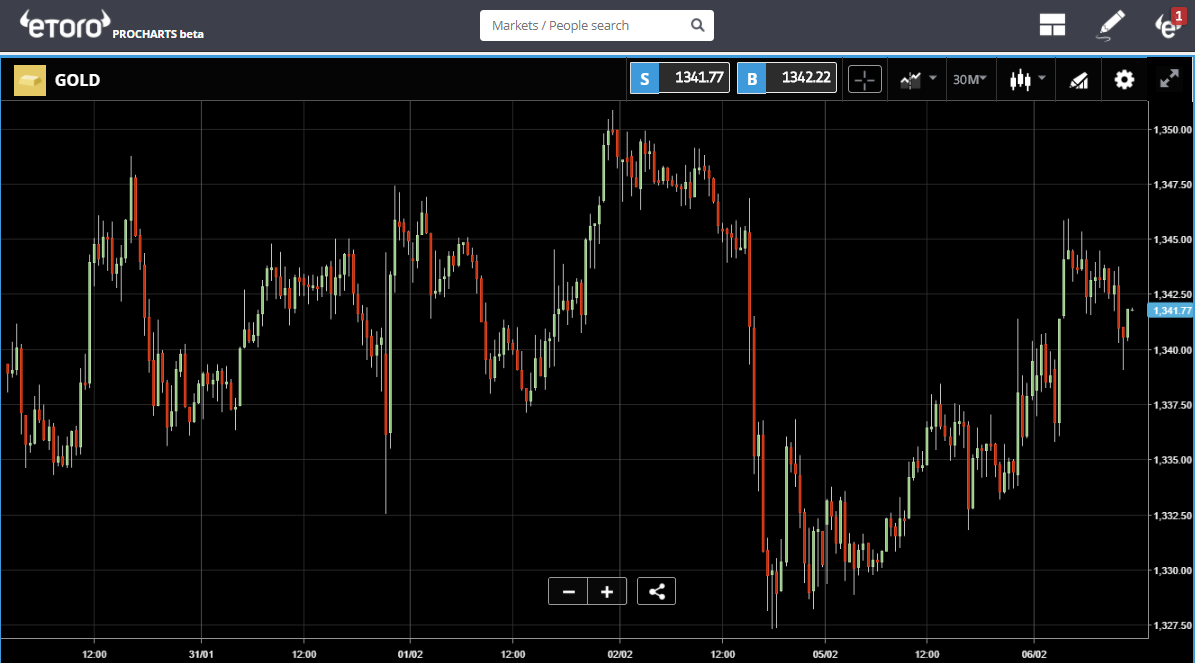
One thing I haven't quite figured out is, if there are fears of inflation, why isn't gold going through the roof as it did from 2009 through 2011?
Here we can see, it hasn't budged much since the recent rout began...

One analyst I heard this morning had a good theory. He was saying that at present, stocks traders are panicking. As their accounts go into margin call, they need to free up some cash in order to support their positions. Gold and oil are easy targets to close positions in the green and support those red positions.
What about Crypto?
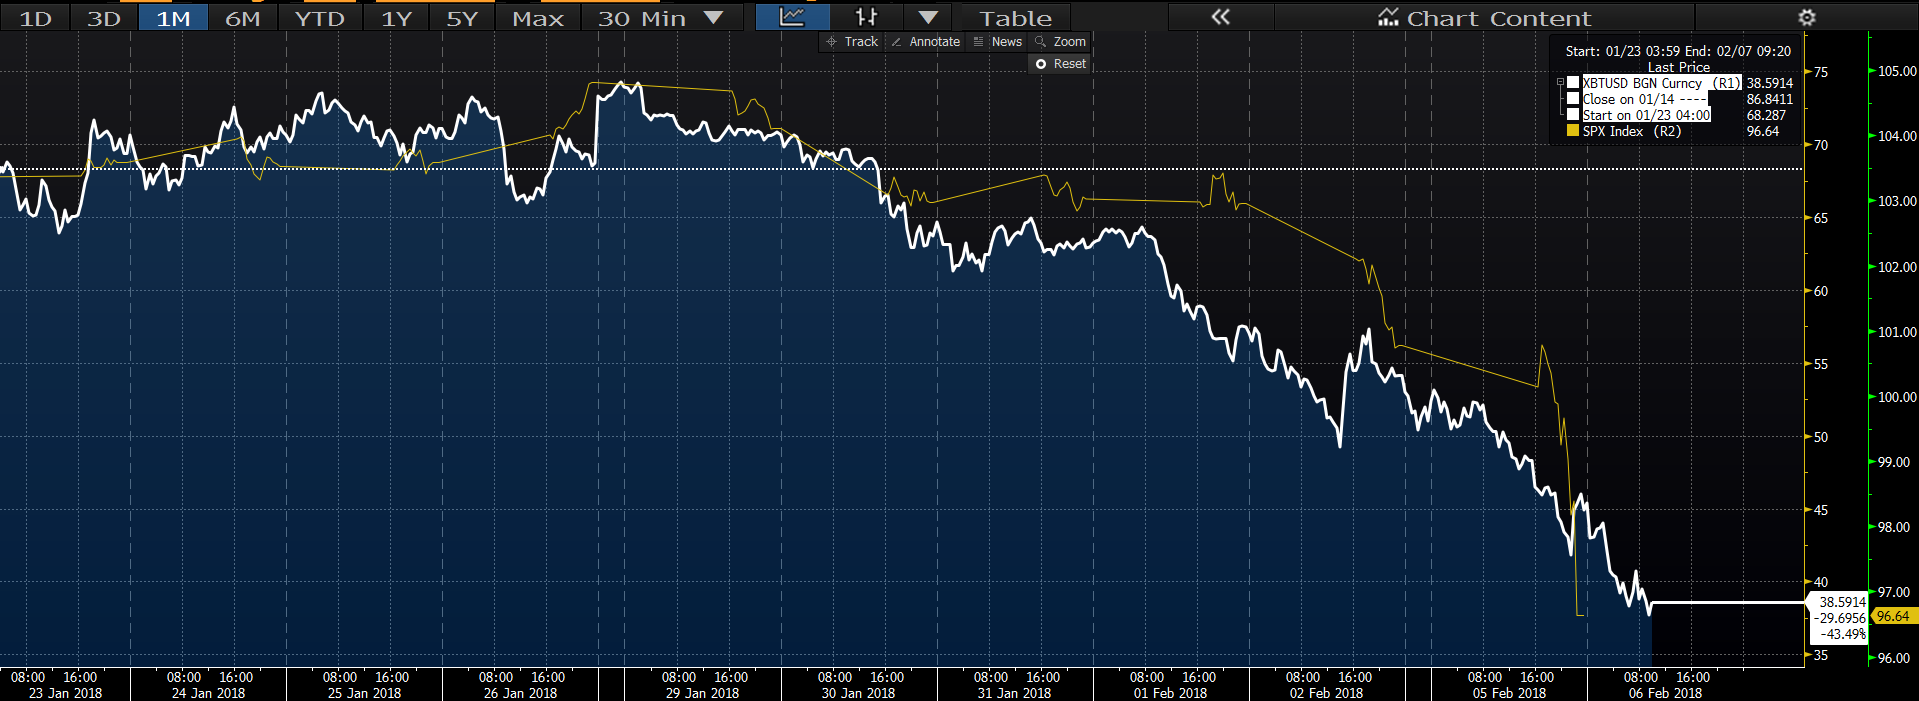
Crypto is just as much a part of this selloff as everything else in the world. Here we can see the proof of that...
This chart from Bloomberg shows Bitcoin in white at the S&P 500 in yellow since January 23rd. Notice any similarities???

So, to conclude we must try and think of a trigger for all this. One idea that I'm playing with is that it may have something to do with Korea. Remember, the North and the South joined together for talks on January 9th, the day before the sell-off in bonds.
I know it's a half-baked theory, but it's the best I could come up with on short notice. I'd be very happy to hear from my readers if any of you have a clue on what has recently changed in the world that would suddenly prompt investors to remove all risk from their portfolios?
In any case, as mentioned above, this market volatility can potentially create abundant opportunities. In the short term, I expect that many people will take some losses, even the most diversified investors will get a draw down, but for those who know how to react to such events, we'll be seeing great gains.
Let's make it an amazing day!
eToro, Senior Market Analyst
Disclosure: This content is for information and educational purposes only and should not be considered investment advice or an investment recommendation. Past performance is not an indication of future results. All trading carries risk. Only risk capital you're prepared to lose.
