Get 40% Off
👀 👁 🧿 All eyes on Biogen, up +4,56% after posting earnings. Our AI picked it in March 2024.
Which stocks will surge next?
Unlock AI-picked Stocks

Where Does The Market Go From Here?

Published 06/07/2021, 06:33 PM
Updated 07/09/2023, 06:31 AM

A Long-Term View Of The Market

Technically, not much has changed over the past month. In our May Market Update, I wrote about how in the long-term, the market is extended and short-term, it’s consolidating. That is still the case.

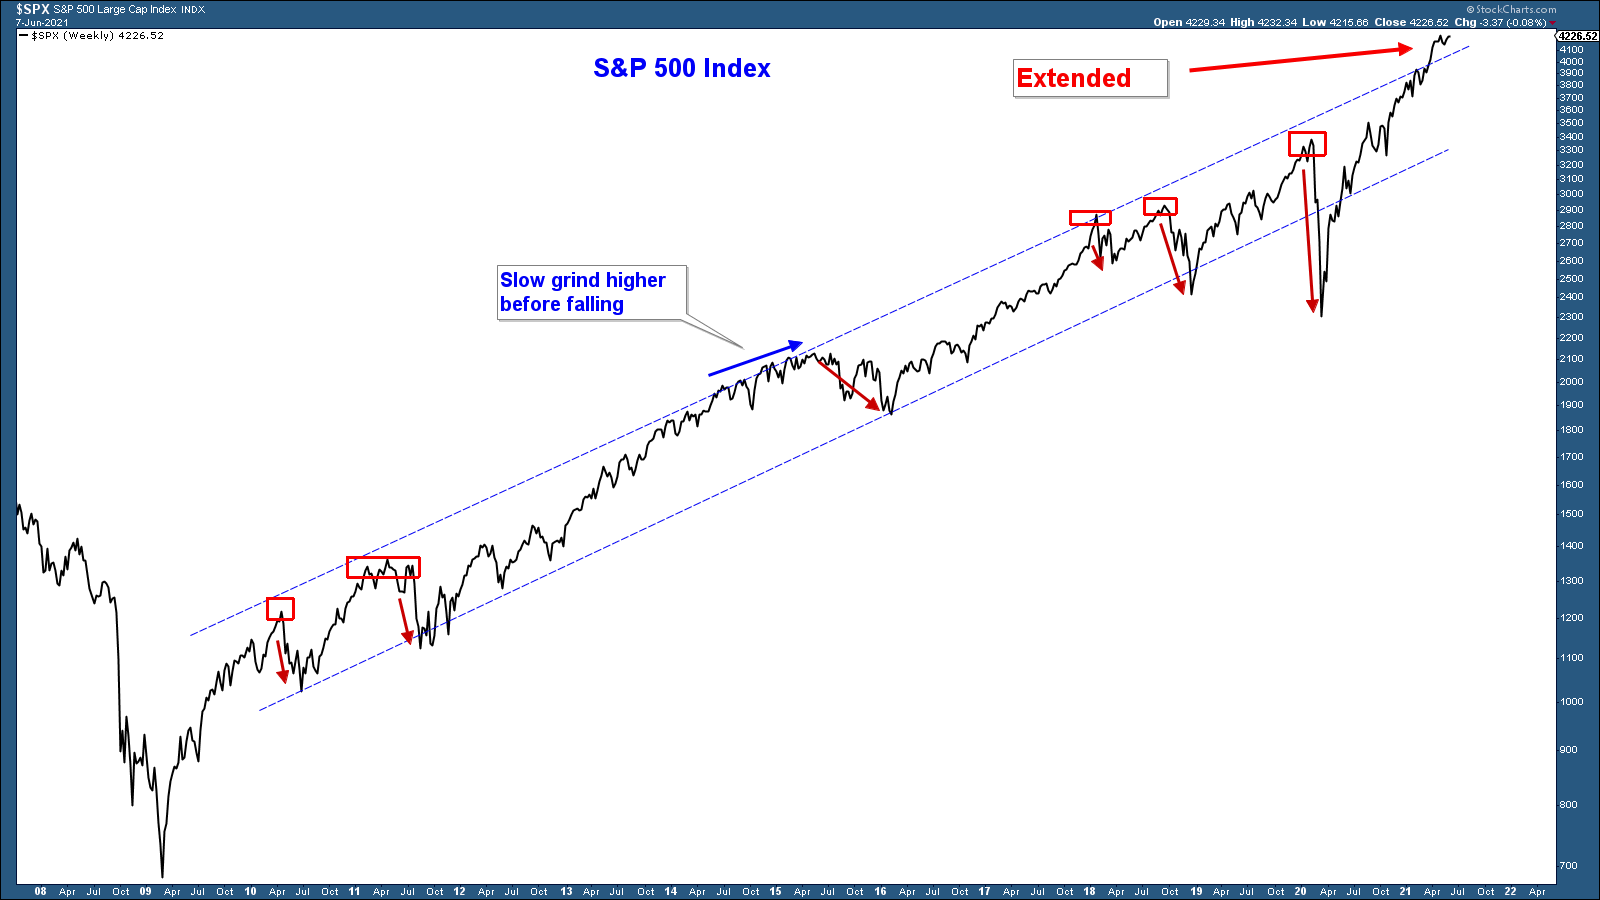
Below is a long-term chart of the S&P 500. Notice how the index has advanced within a channel. Historically, each time the index has reached the top end of the channel it has either quickly corrected or slowly advanced higher before eventually pulling back to the bottle of the channel.

A Short-Term View Of The Market

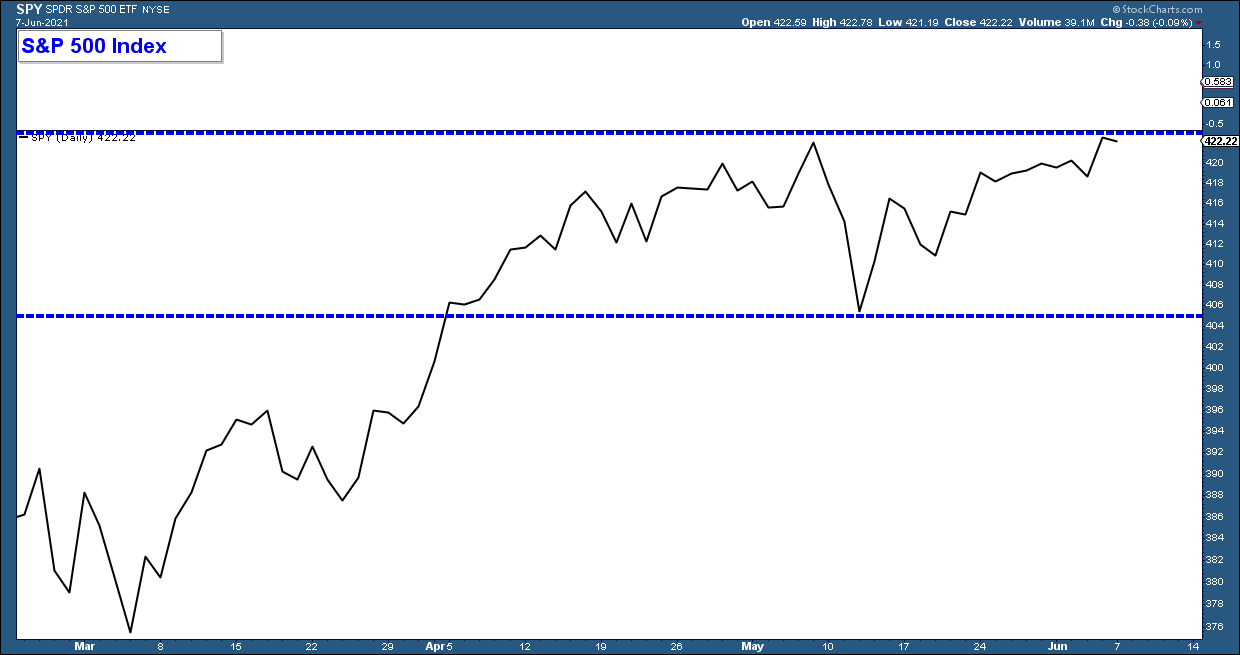
Below is a short-term chart of the S&P 500 index. It has been consolidating since the beginning of April.

The Nasdaq 100 Index has been oscillating sideways since February.

NASDAQ 100 Daily Chart.

Same thing with small caps (iShares Russell 2000 ETF (NYSE:IWM). They have gone nowhere since early February.

IWM Daily Chart.

Where Does The Stock Market Go From Here? Higher? Lower? Or Continue To Consolidate?

Can the market advance strongly above this area of consolidation?

The S&P 500 is at the top of its consolidation pattern and near all-time highs. Given this, you might think that would be the most likely scenario.

The problem is that the weight of the technical evidence seems to suggest that the market may not be strong enough to sustain an advance.

Remember last year when the market fell 33% in four weeks? Just before that drop, we were seeing the same long-term extended conditions that we are witnessing currently. Check out our February 2020 Market Update that was published about a week before the big drop.

3rd party Ad. Not an offer or recommendation by Investing.com. See disclosure here or remove ads .

During strong market advances, you typically see risk-on assets outperforming. Here is a chart of consumer discretionary (risk-on) relative to consumer staples (risk-off) in the lower panel. When consumer staples are outperforming the line falls which is what has been occurring since February.

XLY:XLP Chart.

How about semiconductor stocks? These stocks are a classic risk-on asset so we want to see them outperform to confirm market strength.

Below we chart them relative to consumer staples and we see the same thing. Underperformance going back to February.

SOXX:XLP Chart.

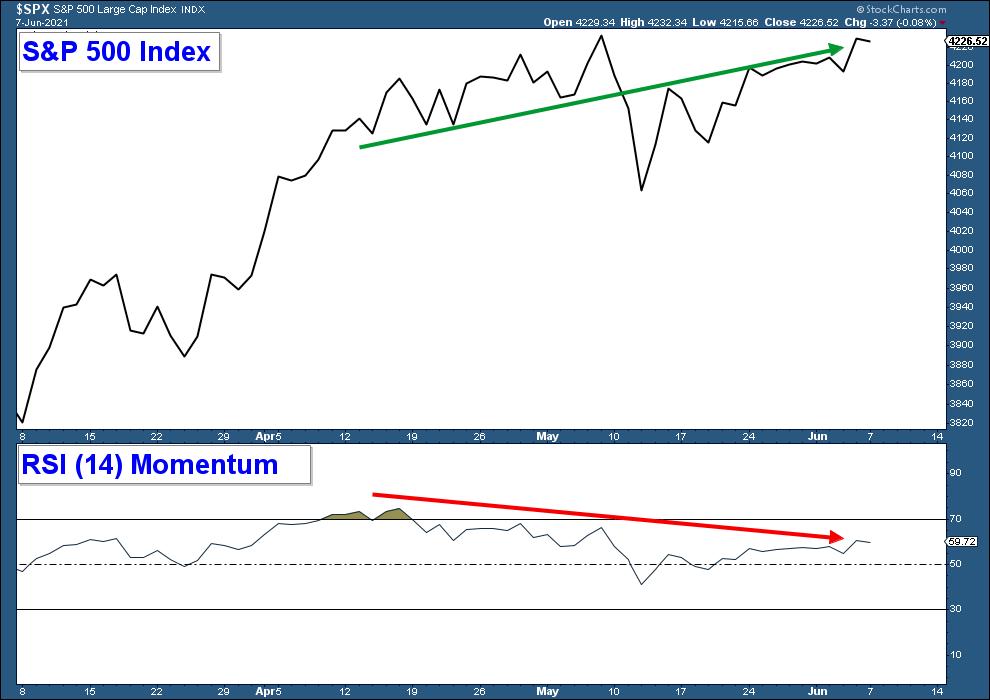
Short-term momentum is diverging negatively with the market, which can happen at key market turning points.

See how momentum is falling as the S&P 500 has risen. While momentum indicators are lower on my priority list, they can provide early warning signs of an imminent market move. This time momentum is suggesting near-term market weakness.

The Bottom Line

In summary, the market is in a confirmed long-term uptrend; however, extended with weak internals. This suggests that the risk of continued short-term choppiness or even a pullback in the market is elevated.

Latest comments

To the moon!
Great analysis! Its all in the hands of FED! Market is getting freedier and will soon be punished!
Up until FED starts winding down its balance sheet then down down down...this is clear as water !
How big can the bubble get?…that is the question. How long will the Fed inject liquidity?
Up.
Hi
Thanks for sharing your thoughts Sir.
Risk Disclosure: Trading in financial instruments and/or cryptocurrencies involves high risks including the risk of losing some, or all, of your investment amount, and may not be suitable for all investors. Prices of cryptocurrencies are extremely volatile and may be affected by external factors such as financial, regulatory or political events. Trading on margin increases the financial risks.
Before deciding to trade in financial instrument or cryptocurrencies you should be fully informed of the risks and costs associated with trading the financial markets, carefully consider your investment objectives, level of experience, and risk appetite, and seek professional advice where needed.
Fusion Media would like to remind you that the data contained in this website is not necessarily real-time nor accurate. The data and prices on the website are not necessarily provided by any market or exchange, but may be provided by market makers, and so prices may not be accurate and may differ from the actual price at any given market, meaning prices are indicative and not appropriate for trading purposes. Fusion Media and any provider of the data contained in this website will not accept liability for any loss or damage as a result of your trading, or your reliance on the information contained within this website.
It is prohibited to use, store, reproduce, display, modify, transmit or distribute the data contained in this website without the explicit prior written permission of Fusion Media and/or the data provider. All intellectual property rights are reserved by the providers and/or the exchange providing the data contained in this website.
Fusion Media may be compensated by the advertisers that appear on the website, based on your interaction with the advertisements or advertisers.
© 2007-2024 - Fusion Media Limited. All Rights Reserved.