Key Points:
- Ranging phase now looking likely due to some strong resistance.
- Stochastics signalling a reversal is probably next on the cards for silver.
- Market uncertainty could cap downside risks in the long-term.
Silver prices could be about to moderate moving forward which should lead to a short ranging phase for the metal. Specifically, both some robust support and resistance levels are presently in place which seems to be keeping the commodity well contained. As a result of this, there could be some solid range-bound trading opportunities on offer for those watching silver and these are worth taking a closer look at.
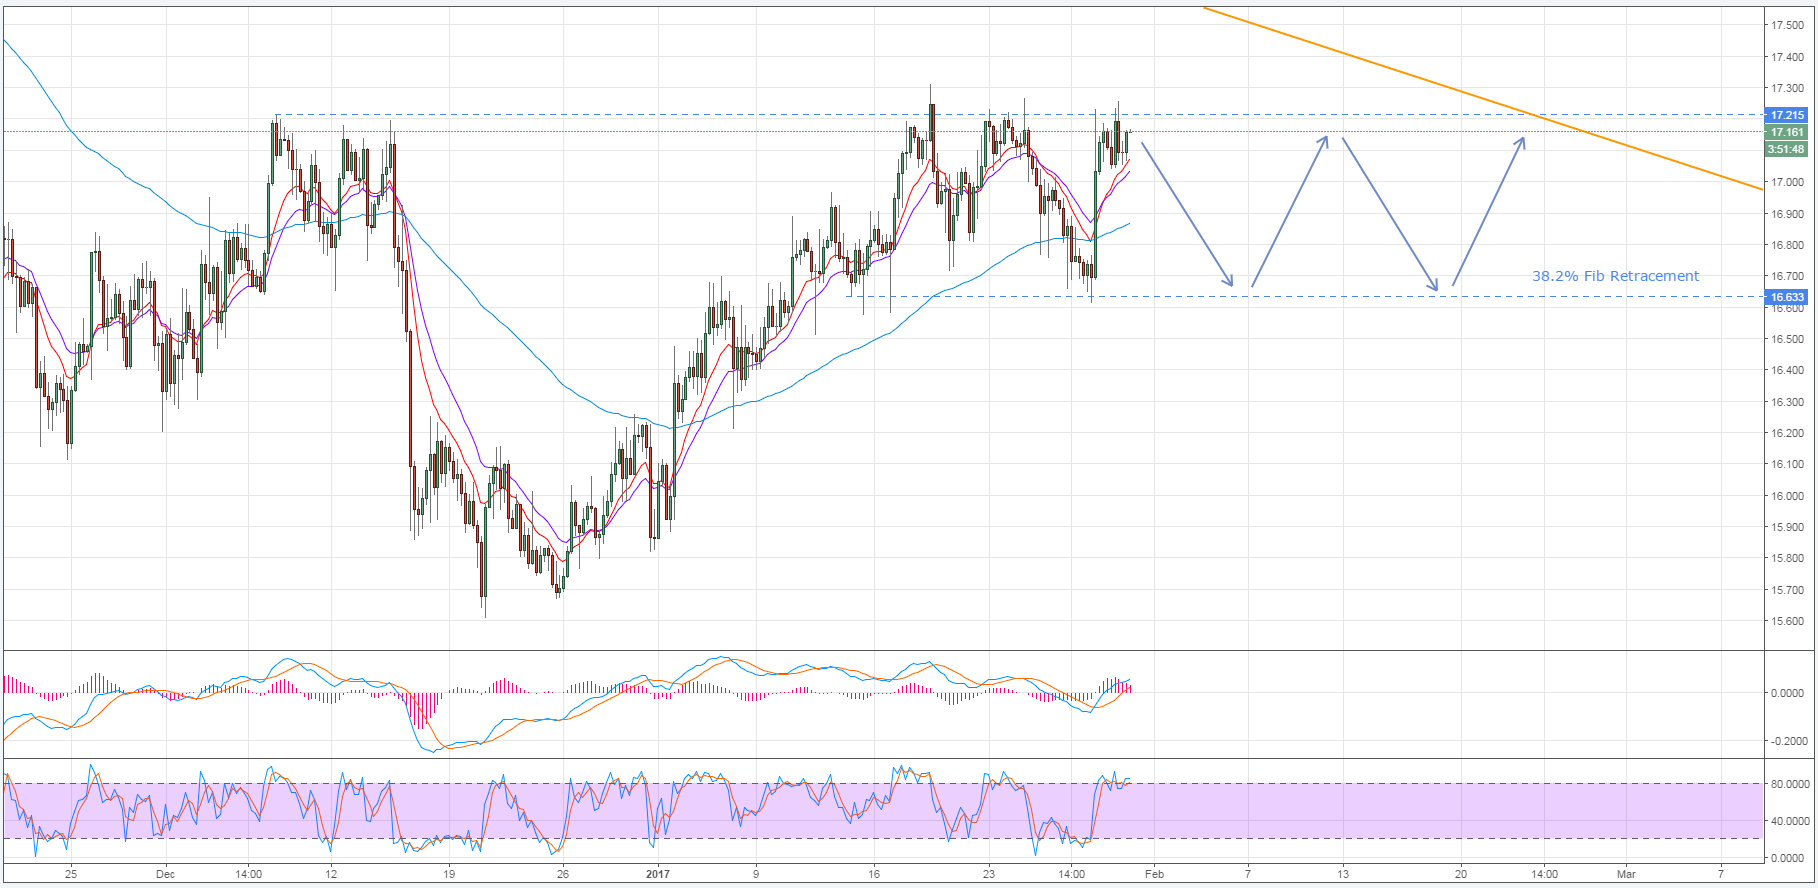
Firstly, as is shown on the below chart, the two levels we expect to see silver remain ranging between are the 17.215 and 16.633 price levels. Starting with the upper limit of the sideways channel, this resistance should remain intact for a number of reasons. Primarily, it is because it has historically proven itself to be rather resistant to breakout attempts. However, whilst not shown, the 100 day EMA is also providing dynamic resistance around this level which will certainly be capping upside potential in the short- to medium-term.

Looking now to the lower boundary of the channel, this price coincides with the 38.2% Fibonacci retracement which has likewise weathered a number of attempts at a break out. Aside from this, the generally bullish short-term EMA bias on both the daily and H4 charts is providing some buoyancy which will limit the bear’s ability to resume the long-term bearish trend for at least the next few sessions.
With respect to the next handful of sessions, as a result of the channel described above, a reversal is expected which could see the 16.633 price tested. Such a sizable slip shouldn’t come as a total surprise as even a cursory glance at the metal shows that it is firmly in overbought territory on both the daily and H4 timeframes. Additionally, due to the reasons given above, it looks fairly unlikely that the lower constraint of the channel is destined to break during this latest tumble. What’s more, if we do see the forecasted movement, it would serve to confirm the presence of the ranging phase which should provide a decent guide for where we can expect to see silver remain for the first half of February.
Ultimately, we are probably going to see the trend line make itself felt once again which could see the bears take control of the metal and break free of this moderating phase. However, don’t discount the effects of the general uptick in market uncertainty which could help to counteract the influence of this long-term bias. As a result, monitor the fundamental side of things closely as silver approaches the intersection of the 17.215 resistance level and the long-term trend line.
