
Ryder System, Inc. (NYSE:R) is scheduled to report fourth-quarter 2018 results on Feb 14, before market open.
In the third quarter, the company delivered impressive results, with earnings and revenues beating the Zacks Consensus Estimate. The bottom line was favored by higher revenues and lower tax rate. Also, the top line improved year over year on the back of strong segmental performance.
Ryder has an impressive earnings surprise history. The company’s earnings surpassed the consensus mark in three of the trailing four quarters, the average being 3.9%.
Factors at Play
We expect key segments of the company to perform well in the fourth quarter of 2018, which will boost the top line. The Zacks Consensus Estimate for fourth-quarter 2018 revenues is pegged at $2,172 million, reflecting a rise form 2,158 million reported in the third quarter of 2018.
Notably, Ryder conducts its business through three segments — Fleet Management Solutions (FMS), Dedicated Transportation Solutions (DTS) and Supply Chain Solutions (SCS). We expect strong performance in the FMS segment, which contributes majorly to the top line, to boost top-line results in the to-be-reported quarter. The consensus estimate for fourth-quarter revenues in the FMS segment is pegged at $1,362 million, indicating a rise from $1,337 million reported in the last reported quarter.
Also, impressive performance in the SCS segment is expected to boost the top line in the quarter under discussion. The consensus estimate for revenues in the SCS segment is pegged at $642 million, reflecting a rise from $629 million reported in the third quarter of 2018. However, the consensus mark for revenues in the DTS segment is flat at $341 million when compared sequentially with the last reported quarter.
Moreover, the current tax law is a boon for Ryder. The significant cut in corporate tax rate is likely to boost cash flow, which will drive the bottom line. The consensus mark for fourth-quarter 2018 earnings per share is pegged at $1.81, indicating an increase from $1.64 reported in the third quarter of 2018.
However, the bottom line is expected to be hurt in the quarter due to high capital expenditures incurred on investments in lease and rental fleets. We are also concerned about the company’s high-debt levels.
Ryder System, Inc. Price and EPS Surprise
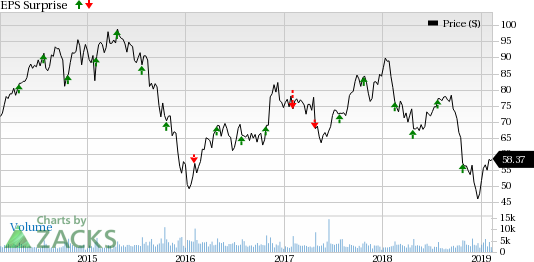
Ryder System, Inc. Price and EPS Surprise | Ryder System, Inc. Quote
Earning Whispers
Our proven model does not indicate estimates beat for Ryder this quarter. This is because a stock needs to have a positive Earnings ESP and a Zacks Rank #1 (Strong Buy), 2 (Buy) or 3 (Hold) for this to happen. However, that is not the case here as elaborated below.
Zacks Rank: Ryder carries a Zacks Rank #3.
Earnings ESP: Ryder has an Earnings ESP of 0.00%. The Most Accurate Estimate is at $1.81 per share, in line with the Zacks Consensus Estimate. You can uncover the best stocks to buy or sell before they’re reported with our Earnings ESP Filter.
We caution against Sell-rated stocks (#4 or 5) going into an earnings announcement, especially when the company is seeing negative estimate revisions.
Stocks to Consider
Investors interested in the Zacks Transportation sector may check companies that have the right combination of elements to beat estimates in the upcoming releases.
Azul S.A. (NYSE:AZUL) has an Earnings ESP of +8.16% and a Zacks Rank #1. The company will release fourth-quarter 2018 results on Mar 14. You can see the complete list of today’s Zacks #1 Rank stocks here.
Frontline Ltd. (NYSE:R) has an Earnings ESP of +4.17% and a Zacks Rank #1. The company will release fourth-quarter 2018 results on Feb 28.
GOL Linhas Aéreas Inteligentes S.A. (NYSE:GOL) has an Earnings ESP of +17.07% and a Zacks Rank #3. The company will release fourth-quarter 2018 results on Feb 28.
Zacks' Best Stock-Picking Strategy
It's hard to believe, even for us at Zacks. But from 2000-2018, while the market gained +4.8% per year, our top stock-picking strategy averaged +54.3% per year.
How has that screen done lately? From 2017-2018, it sextupled the market's +15.8% gain with a soaring +98.3% return.
Free – See the Stocks It Turned Up for Today >>
Gol Linhas Aereas Inteligentes S.A. (GOL): Free Stock Analysis Report
Ryder System, Inc. (R): Free Stock Analysis Report
Frontline Ltd. (FRO): Get Free Report
AZUL SA (AZUL): Free Stock Analysis Report
Original post
Zacks Investment Research