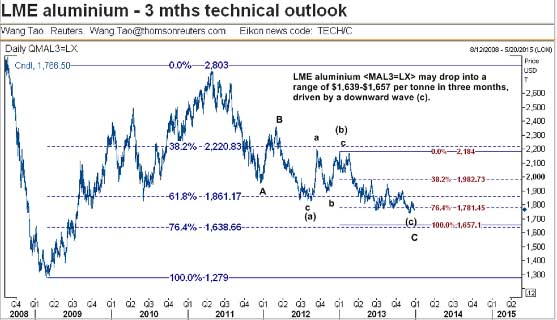
Reuters’ Wang Tao, one of the more prominent chartists out there, suggests aluminum may drop to a range of $1,639-$1,657 per metric ton in three months, driven by a downward wave C.
This is the third wave of a bigger wave C that developed from the March 2, 2012 high of $2,361.50. A Fibonacci projection analysis reveals that the wave C has travelled below a support at $1,781, its 76.4% level, and is heading towards the next support at $1,657.
Taking a longer timeframe also supports this view. A retracement analysis shows that the metal has fallen far below a support at $1,861, the 61.8% retracement on the rise from the Feb. 24, 2009 low of $1,279 to the May 3, 2011 high of $2,803.
Reuters suggests the chances are that it may therefore slide to the 76.4% level at $1,639.
Back in the real world, some analysts have been calling for a sub-$1,700 price for aluminum for some months, but the metal has remained stubbornly above about $1,750. Unless physical market conditions change, we cannot see aluminum at the mid-$1,600s. Unfortunately, Reuters is not putting a timeframe on when this wave C will drop to the mid $1,600s.
What About Oil Prices?
Finally, because its price affects so much in metals-consuming industries, we will include Wang’s analysis for US oil.
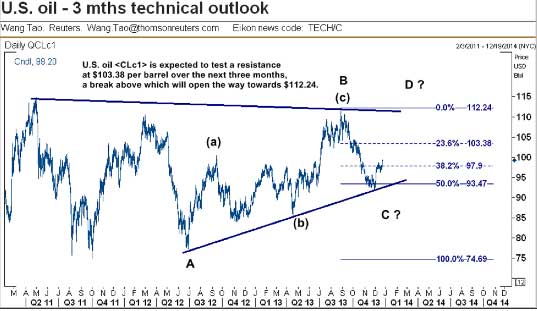
Reuters believes US oil is expected to test a resistance at $103.38 per barrel over the next three months, a break above which will open the way towards $112.24. The paper suggests that oil has been consolidating in a big triangle since the end of April 2011. It might be possible for oil to eventually reach the Aug. 28 high of $112.24, which is close to a resistance provided by the upper trend-line of the triangle: 
The drop from this high has been driven again by a wave C, which was interrupted by a support at $93.47, its 50% Fibonacci projection level. The current rise from the Nov. 29 low of $92.06 is tentatively labeled as a wave D that is heading towards $103.38, the 23.6% projection level, as it has travelled above a resistance at $97.90, the 38.2% level.
Even though the current rise seems to be triggered by the supporting lower trend-line of the triangle, there is a deeper reason.
Looking at wave patterns starting further back, this support has been strengthened by two other supports lines, respectively provided by a trend-line descending from the 2008 high of $104.27 and the June 2012 low of $77.28. Complicated stuff, but suffice to say Reuters says these three supports have worked together to form a support zone that has contributed to the development of the current uptrend.
What This Means for Metal Buyers
Is the analysis a solid guide to future price direction?
We would not suggest that is the case, but certainly enough investors take direction of the Fibonacci analysis as part of their evaluation that projections like this have a bearing on market behavior. Where charts support our wider assessment of price direction, it reinforces our view; where they significantly diverge, it makes us ask why.
But don’t discount them as irrelevant – they influence others even if they don’t influence your assessments.
by Stuart Burns
- English (UK)
- English (India)
- English (Canada)
- English (Australia)
- English (South Africa)
- English (Philippines)
- English (Nigeria)
- Deutsch
- Español (España)
- Español (México)
- Français
- Italiano
- Nederlands
- Português (Portugal)
- Polski
- Português (Brasil)
- Русский
- Türkçe
- العربية
- Ελληνικά
- Svenska
- Suomi
- עברית
- 日本語
- 한국어
- 简体中文
- 繁體中文
- Bahasa Indonesia
- Bahasa Melayu
- ไทย
- Tiếng Việt
- हिंदी
What The Chartists See In Their Crystal Ball For Aluminum, Oil Prices
Published 01/13/2014, 11:48 PM
Updated 07/09/2023, 06:31 AM
What The Chartists See In Their Crystal Ball For Aluminum, Oil Prices
3rd party Ad. Not an offer or recommendation by Investing.com. See disclosure here or
remove ads
.
Latest comments
Install Our App
Risk Disclosure: Trading in financial instruments and/or cryptocurrencies involves high risks including the risk of losing some, or all, of your investment amount, and may not be suitable for all investors. Prices of cryptocurrencies are extremely volatile and may be affected by external factors such as financial, regulatory or political events. Trading on margin increases the financial risks.
Before deciding to trade in financial instrument or cryptocurrencies you should be fully informed of the risks and costs associated with trading the financial markets, carefully consider your investment objectives, level of experience, and risk appetite, and seek professional advice where needed.
Fusion Media would like to remind you that the data contained in this website is not necessarily real-time nor accurate. The data and prices on the website are not necessarily provided by any market or exchange, but may be provided by market makers, and so prices may not be accurate and may differ from the actual price at any given market, meaning prices are indicative and not appropriate for trading purposes. Fusion Media and any provider of the data contained in this website will not accept liability for any loss or damage as a result of your trading, or your reliance on the information contained within this website.
It is prohibited to use, store, reproduce, display, modify, transmit or distribute the data contained in this website without the explicit prior written permission of Fusion Media and/or the data provider. All intellectual property rights are reserved by the providers and/or the exchange providing the data contained in this website.
Fusion Media may be compensated by the advertisers that appear on the website, based on your interaction with the advertisements or advertisers.
© 2007-2024 - Fusion Media Limited. All Rights Reserved.
