
GDP growth slowed in Hong Kong in the third-quarter but beat forecasts. Hong Kong's economy grew 3.6% in the third quarter compared with 3.9% in the prior quarter. However, it surpassed expectations of 3.5% by economists polled by the Wall Street Journal. The economy grew 0.5% sequentially compared with 1.1% for the previous quarter.
What’s Driving the Stocks?
Global economic activity seems to be picking up as the International Monetary Fund (IMF) estimates 3.6% and 3.7% growth in 2017 and 2018, respectively, compared with 3.2% in 2016. The IMF raised its forecasts from the estimates released in April 2017 with easing global macro tensions and accelerating global growth.
Strong global momentum drove growth in the economy. Making for two-thirds of the country’s GDP, private consumption grew 6.7% year over year compared with 5.4% in the previous quarter. Moreover, stronger export growth also provided support to the economy. Exports increased 5.5% year over year, same as the previous quarter.
Services exports grew 3.7% year over year compared with 2.6% in the preceding quarter. The government now expects 3.7% GDP expansion this year compared with its previous forecast of the GDP growing in the mid-point of the 3-4% range.
Optimism about third-quarter earnings of tech companies has also driven stocks in the region. Moreover, greater IPO activity has been a positive for markets in the region. Moreover, strong inflation data in China made investors optimistic about economic momentum gaining steam in the region (read: China ETFs in Focus as Inflation Increases).
Risks Involved
The Chinese government has been facing challenges of curbing property market speculation and high debt. The government’s crackdowns on financial risks led to a slowdown in economic activity in some parts of the country. Although the twice-in-a-decade Congress meet led to some calm in the Chinese markets initially, deleveraging concerns weighed on the stocks, owing to a slew of poor economic data. Therefore, rising debt-related risks in China cloud the outlook for markets in the mainland as well as Hong Kong.
Uncertainty is mounting on the timely passing of the U.S. tax reform. Per Washington Post reports, Senate Republican leaders are weighing the impact of a one-year delay in reforms. This might weigh on Hong Kong listed companies with ADRs in the U.S. (read: Treasury ETFs in Focus on Potential Delay in Tax Reform)
Let us now discuss the most popular Hong Kong based ETF.
iShares MSCI Hong Kong ETF EWH
This fund offers exposure to equities of companies domiciled in Hong Kong. It offers a pure play to investors looking for exposure to the region.
EWH has AUM of $1.9 billion and charges 48 basis points in fees per year. Real Estate, Insurance and Capital Goods are the top three sectors of this fund with 26.8%, 18.6% and 11.9% allocation, respectively (as of Nov 10, 2017). The top three holdings are AIA Group Ltd, Hong Kong Exchanges and Clearing Ltd and CK Hutchison Holdings Ltd, with 18.6%, 6.7% and 6.6% allocation, respectively (as of Nov 10, 2017). It has returned 30.6% year to date and 22.3% in a year (as of Nov 10, 2017). EWH has a Zacks ETF Rank #3 (Hold) with a Medium risk outlook.
We will now compare the performance of EWH to a broad-based China ETF, FXI.
iShares China Large-Cap ETF (ST:FXI)
This fund seeks to provide exposure to Chinese equities, serving as a pure play on the economy.
It has AUM of $3.7 billion and is a relatively expensive bet as it charges a fee of 74 basis points a year. From a sector look, Financials, Energy and Information Technology are the top three allocations of the fund, with 52.5%, 11.3% and 10.1% exposure, respectively (as of Nov 9, 2017). From an individual holding perspective, Tencent Holdings Ltd, China Construction Bank Corp and Industrial and Commercial Bank of China are the top three allocations of the fund, with 10.1%, 8.5% and 7.7% exposure, respectively (as of Nov 9, 2017). The fund has returned 35.8% year to date and 31.0% in a year (as of Nov 10, 2017). FXI currently has a Zacks ETF Rank #3 (Hold) with a Medium risk outlook.
Below is a chart comparing the year-to-date performance of the two funds.
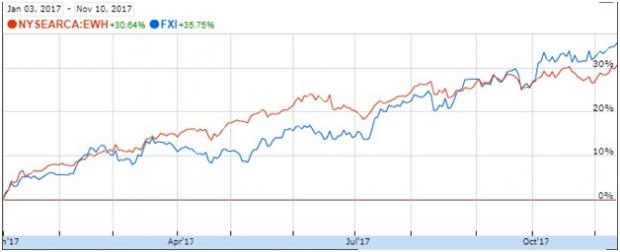
Source: Google (NASDAQ:GOOGL) Finance
Want key ETF info delivered straight to your inbox?
Zacks’ free Fund Newsletter will brief you on top news and analysis, as well as top-performing ETFs, each week. Get it free >>
ISHARS-CHINA LC (FXI): ETF Research Reports
ISHARS-HONGKONG (EWH): ETF Research Reports
Original post
Zacks Investment Research