The world is still battling a pandemic, the U.S. government is in turmoil and there’s no shortage of other events lurking on the global stage that could cause trouble for asset markets. Should we add in rising interest rates to the list of worries?
“Markets are now definitely pricing in rate hikes by the second half of 2023, but the timeframe is a long way away and it will keep shifting, especially if the U.S. continues to lose jobs as they did in December,” says Kenneth Broux, a strategist at Societe Generale (OTC:SCGLY) in London.
The future is still uncertain, but rates are clearly rising, albeit from an unusually low base. It’s unclear if the rise is one more in a line of temporary upside runs in an otherwise secular decline. Analysts have been predicting the end of the slide in yields for several decades and they’ve been wrong every time. Is this time different? Maybe. But the jury’s still out and it’ll take several months at the least to develop convincing evidence to the contrary.
Meantime, let’s take a quick look at the relationship between the benchmark 10-year Treasury yield vs. benchmarks for three asset classes that tend to figure prominently in asset allocation strategies: U.S. stocks, U.S. real estate investment trusts (REITs) and gold. The other broad brush measure of conventional asset classes (bonds) needs no analysis since rising rates, by definition, translate to falling prices for fixed-income securities.
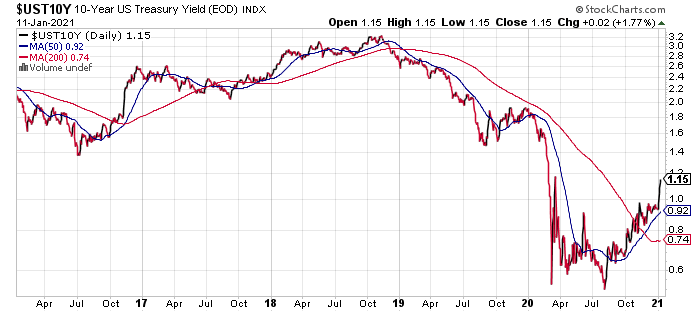
Let’s begin by looking at the recent trend in the 10-year rate. As the chart below shows, there’s been a clear upside break in recent months. The rise to 1.15% yesterday (Jan. 11) marks the highest level since last March. The increase in the rate’s 50-day moving average above the 200-day average late last year suggests that a strong upside bias will persist for the near term.
Now, we turn to the relationship between stocks and the 10-year rate. There are many ways to model this relationship and what follows is barely dipping our statistical toes into the ocean of possibility. But every analytical journey has to start somewhere, and as a quick look into the relationship it’s reasonable to ask: How do one-year rolling changes compare?
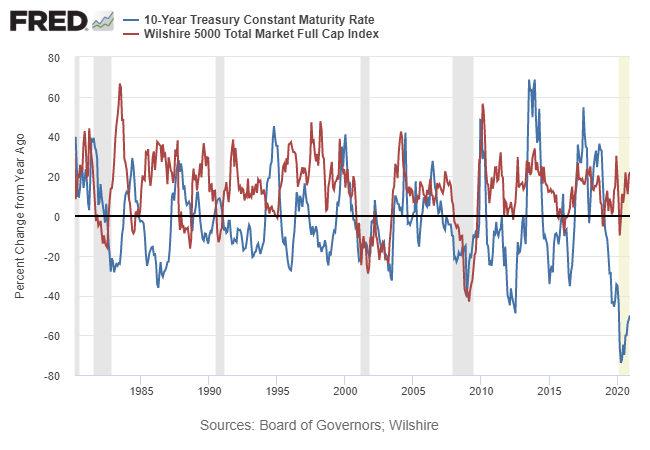
Glad you asked. The next chart offers some preliminary insight by comparing the percentage changes in the 10-year yield vs. a benchmark for U.S. stock prices (Wilshire 5000 Index). The main takeaway: there’s a tight relationship — sometimes. But the two are hardly joined at the hip through time. In fact, the relationship is quite weak over the full history since 1980. The correlation for the two monthly data sets is roughly 0.13, which is close to zero, meaning that there’s no reliable relationship to speak of.
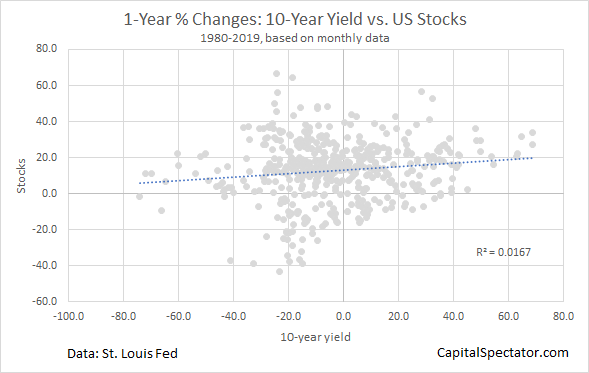
Viewing the same data in a scatterplot confirms that the 1980-2019 results strongly suggest that the link between changes in the 10-year rate and the U.S. stock market over one-year windows is thin.
Part of the reason for the shifting relationship is economic. Identifying the macro reasons for why interest rates are rising or falling is critical for assessing the likely impact on stock prices. As a simple example: if rates are rising because economic growth is picking up, that’s likely to be relatively bullish for stocks. By contrast, if rates are rising because the central bank is trying counter hotter inflation, it’s reasonable to assume that this isn’t great news for the equity market.
Note, however, that over some periods the connection is tight. For example, in the period leading up to, through, and immediate after the 2008-2009 economic recession, the changes in the 10-year rate and equities were highly correlated. That is, stock prices tanked along with the 10-year rate going into the recession. The opposite unfolded as the economic contraction ended.
Keep in mind that other time windows will show different results. But for this initial look at rolling 1-year changes the numbers overall suggest that we should be cautious before deciding that higher interest rates alone are a high-confidence reason to expect that stock prices will dive (or rise, for that matter).
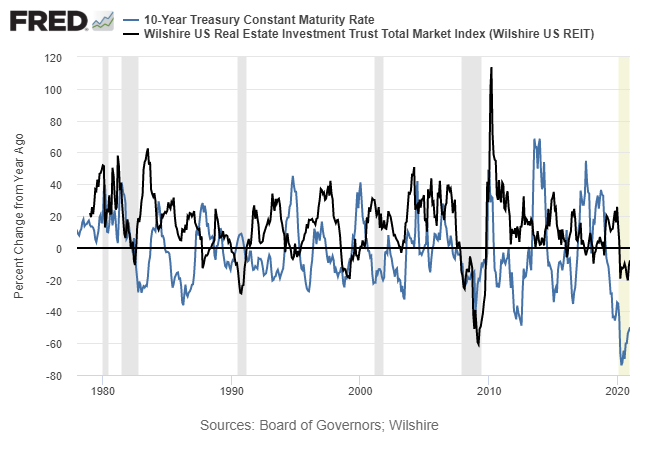
How does the 10-year yield relationship compare with REITs? Given that property shares (Wilshire REIT Index) are highly prized for relatively high payouts implies that there will be a stronger negative correlation with Treasury yields. In fact, monthly data for one-year changes isn’t all that different than the connection for stocks. Although REIT returns and the 10-year yield are closely connected at times, overall the relationship reflects a correlation of about 0.10. One reason may be that equity beta dominates REIT pricing vs. the property factor.
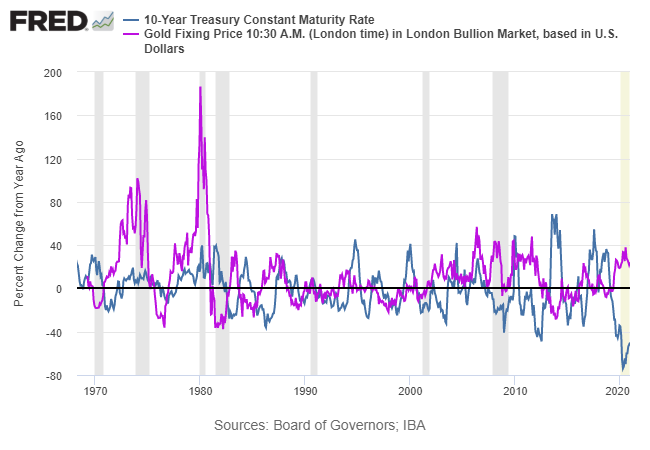
Finally, here’s how 1-year changes for gold stack up against the 10-year yield. Here, too, the relationship is mixed and so it’s risky to draw hard and fast conclusions. The correlation between the two is slightly negative but still close to zero. Although gold is influenced by interest rates, the economic and financial context matters, perhaps a lot.
The analysis above suggests caution in assuming that a rising 10-year Treasury yield is a strong factor for predicting near-term returns in stock, REITs and gold. Interest rates are obvious a key variable for developing expectations about expected return, but looking at it in isolation doesn’t offer a silver bullet, at least not for the 1-year horizon. Ideally, the relationships above would reflect strong negative or positive correlations, which in turn would provide confidence about projecting returns. But the numbers suggest otherwise.
But let’s not be too hasty. The lack of traction in the simple analysis above is hardly definitive. Reality is more nuanced, starting with the observation that the 10-year rate’s influence ebbs and flows, depending on the economic conditions and the time horizon and that’s not always obvious over long periods of time.
This preliminary step in analyzing how the 10-year rate interacts with other markets is a reminder that the connection between interest rates and asset classes is complicated. That’s different than saying it’s irrelevant. Unfortunately, mapping this relationship requires a deeper dive than comparing rolling one-year changes.
