Turning Points November 4-8
Summary
The purpose of the Turning Points Newsletter is to look at the long-leading leading, leading, and coincidental economic data to determine if the economic trajectory has changed from expansion to contraction -- to see if the economy has reached a "Turning Point."
Overall conclusion: my recession probability in the next 6-12 months is 15%. There is some softness in the data: corporate earnings are down in a majority of industries; there's continued stress in the money market; the manufacturing sector is still soft due to trade-related issues. But the yield curve is starting to "un-invert" and a majority of the other key data is positive.
Long-Leading Indicators
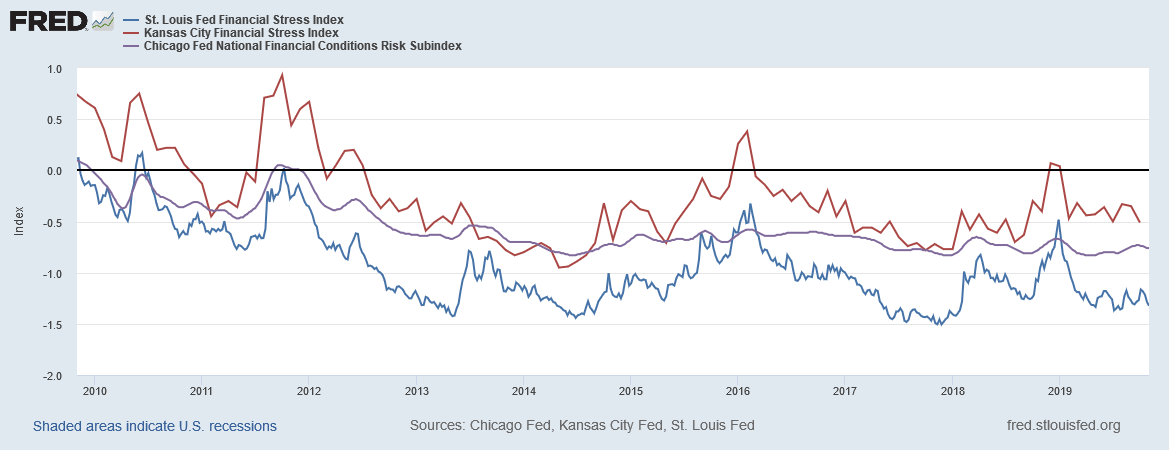
The long-leading indicators are mostly positive. Corporate interest rates across the credit quality spectrum (AAA, BBB, etc.) are low as is the corporate yield curve. According to several measures of risk compiled by the Federal Reserve banks, there is little financial stress:
The Fed has been increasing liquidity:
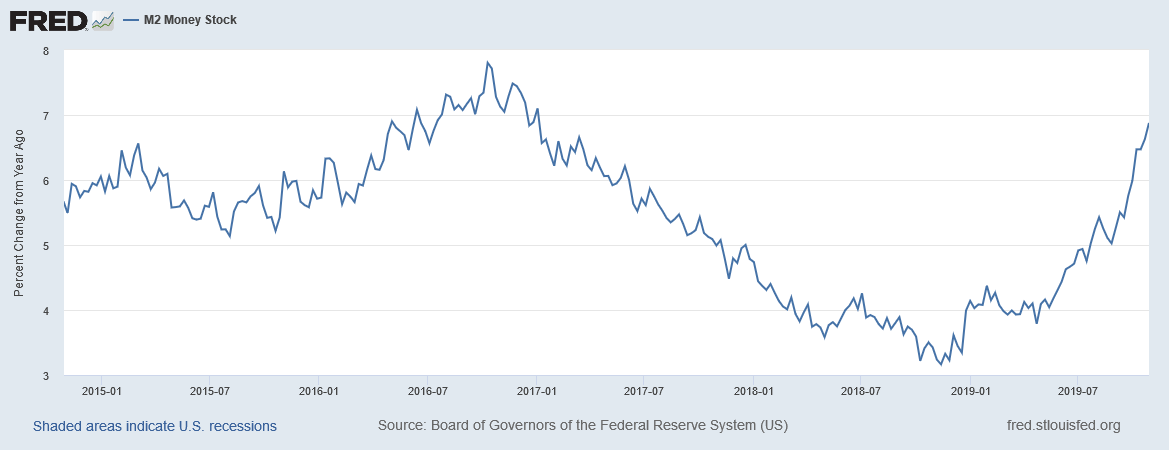
The Y/Y percentage change in M2 is nearing a 5-year high.
The S&P earnings picture is a bit mixed. Revenues are up while earnings are down.
8 of 11 sectors are reporting revenue increases while 5 of 11 industries are reporting earnings growth. Earnings are growing in the utilities and health care and decreasing in energy, materials, and information technology.
The long-leading data is sufficiently strong warrant a positive outlook over the next 6-12 months.
Leading Indicators
While the data here is mostly positive, there are some weak spots, starting with the number of weekly hours working in the manufacturing sector:
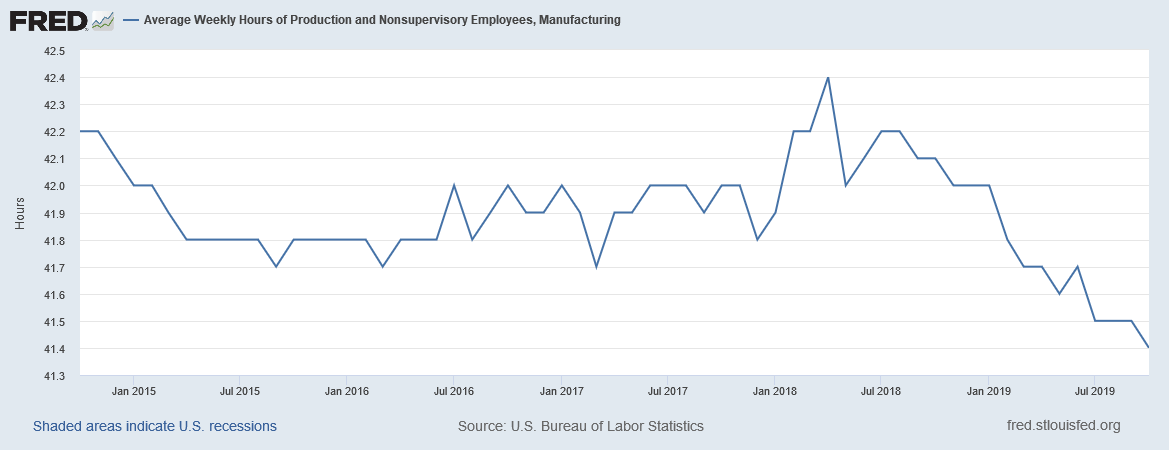
This number has been decreasing since last summer and printed a new, 5-year low in the latest employment report. It is the natural result of weak manufacturing data, which we see in the 3-month contraction in the ISM manufacturing PMI and the soft numbers from the durable goods report.
And, once-again, there has been a spike in the commercial paper market:
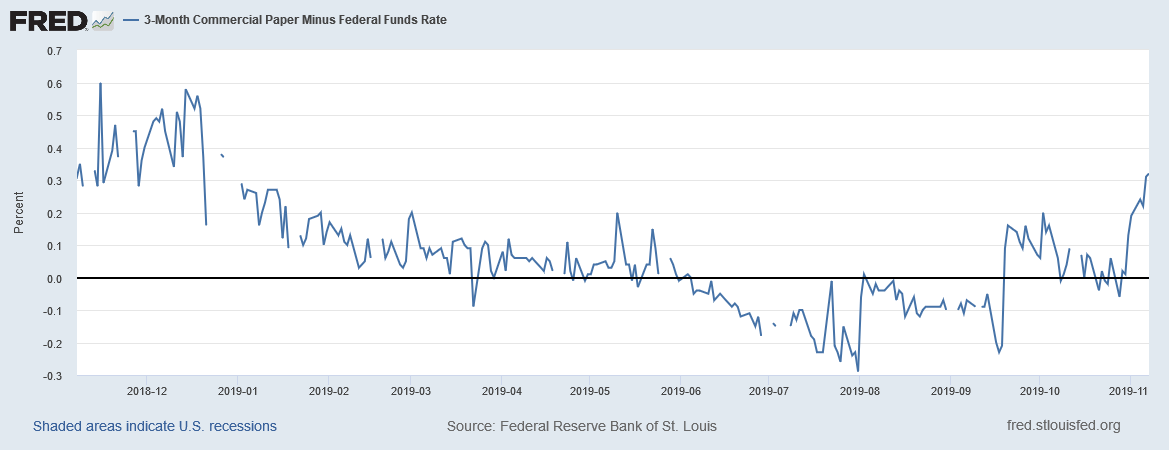
When this problem started, the press noted it was the result of one-off factors such as corporate taxes being due and technical factors caused by the Fed's balance sheet activity. The trend has been occurring long enough to indicate there is something going on, but we don't know what. However, this is not registering in the financial risk measures (see above).
Other measures, however, are positive. The financial markets are now bullish. The S&P 500 has hit new highs and is clearly in rally mode. And the yield curve inversion is lessoning:
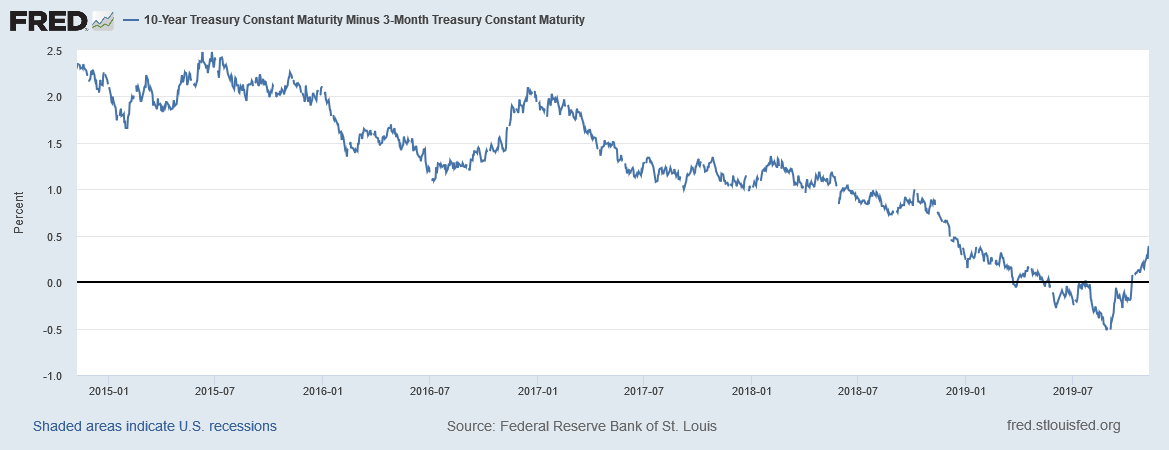
The 10-year-3-month spread has been rising for the last several months.
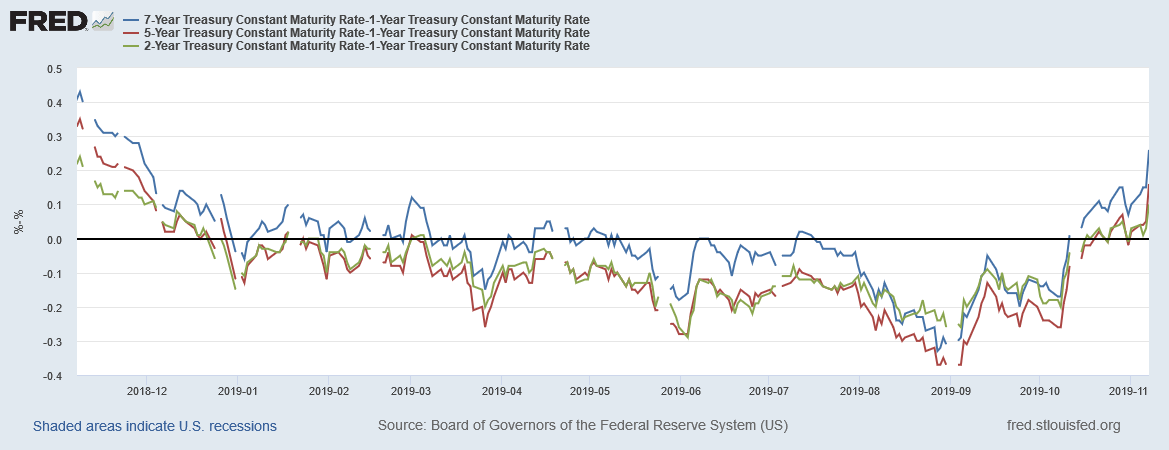
... the 7/5/2-1 year spreads.
However, it's common for the yield curve to improve before the start of a recession:
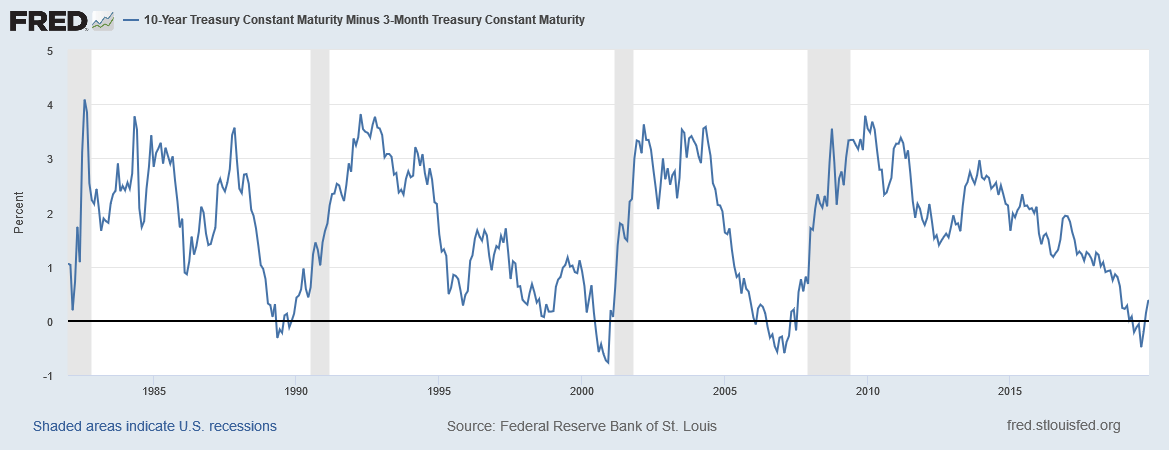
The last three times the yield curve has inverted, it "un-inverted" before the recession.
Am I arguing "this time is different?" There's a good reason to argue yes as all three recession had additional causes. An oil price spike caused by the first Iraq war was a contributing cause of the early 1990s recession; the Nasdaq crash and the 9/11 attacks presaged the early 2000s recession; the housing bust led to the Great Recession. Today, it's possible that the ancillary effects of the trade war might cause the next recession, which we're seeing in softer industrial production data, the 3-months of contraction in the ISM manufacturing PMI, and declining weekly hours worked in the manufacturing sector. But the data is soft, not contracting -- at least, not yet. And manufacturing is a small percentage of the US economy relative to the service sector (which is still in good shape). Finally, there are continued rumblings of a positive resolution to the US-China conflict, which, should it occur, would go a long way to ending the problem.
Leading indicators conclusion: the data here is mostly positive. Manufacturing data is soft but does not indicate a recession -- at least, not yet. Other data is sufficiently positive to warrant a largely expansionary outlook.
Coincidental Data
Here, the data is mostly positive.
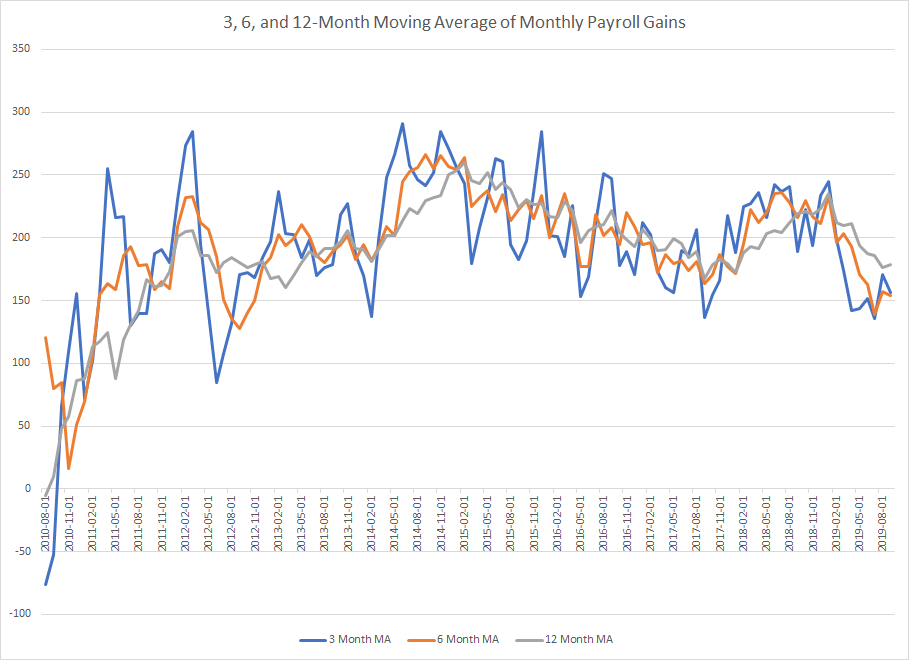
Data from the St. Louis Fred System; author's calculations.
While the 3, 6, and 12-month moving average of the monthly gain in establishment job claims is lower, it's still positive. The decline is easily explained by the length of the economic expansion, which is now in its 10th year.
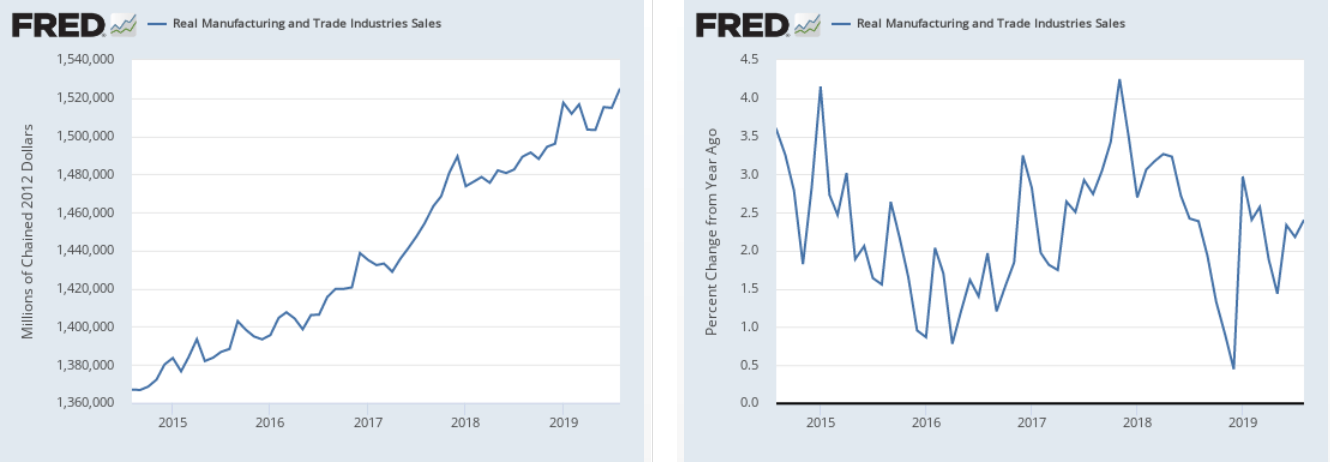
Real manufacturing and trade industry sales continue to grow at an absolute level (left) and Y/Y rate (right).
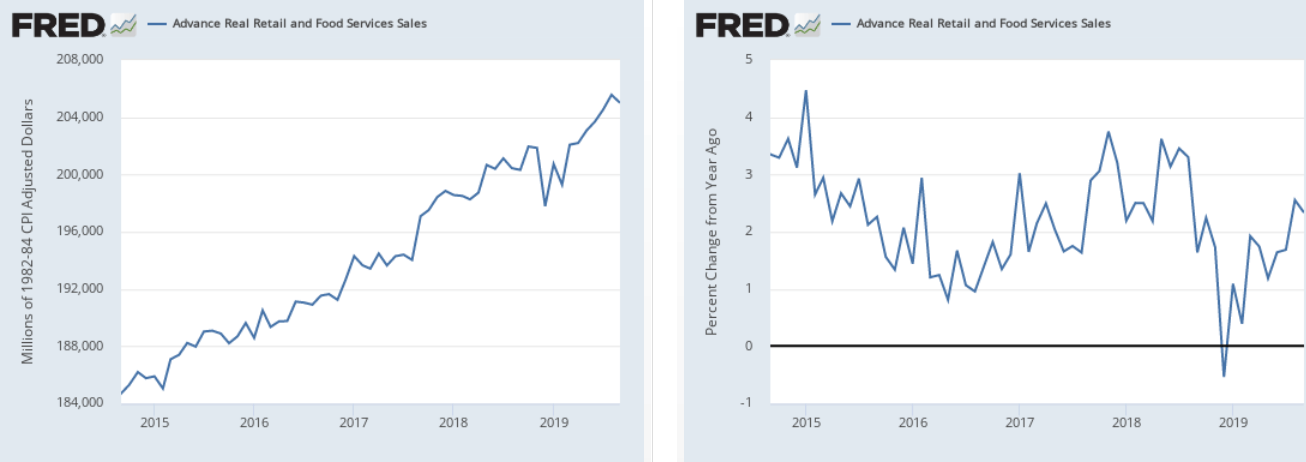
After a lull in 4Q18-1Q19, retail sales are once again expanding at a solid Y/Y percentage rate (right).
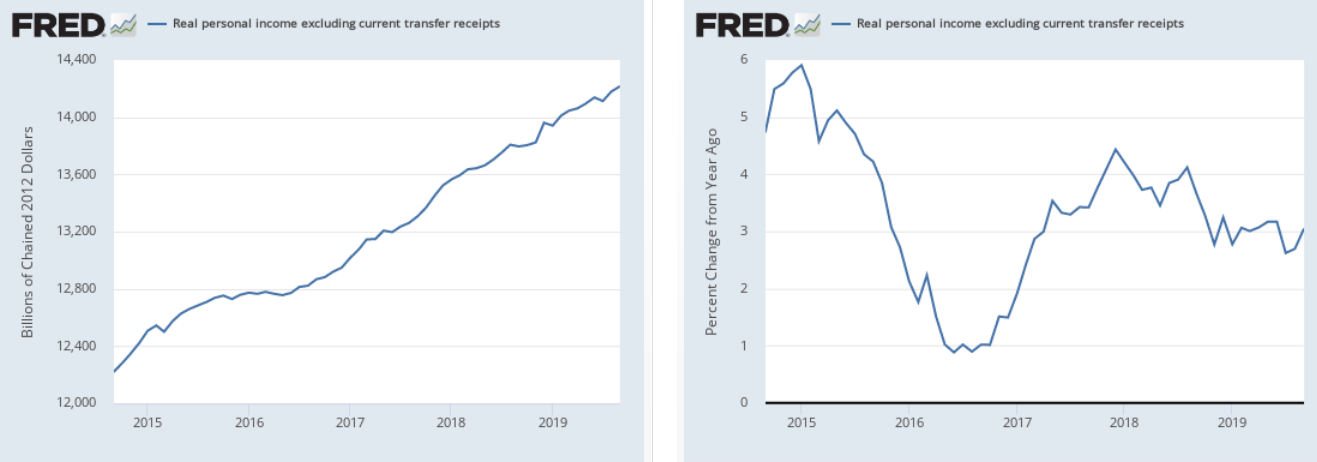
Personal income less transfer payments are growing solidly.
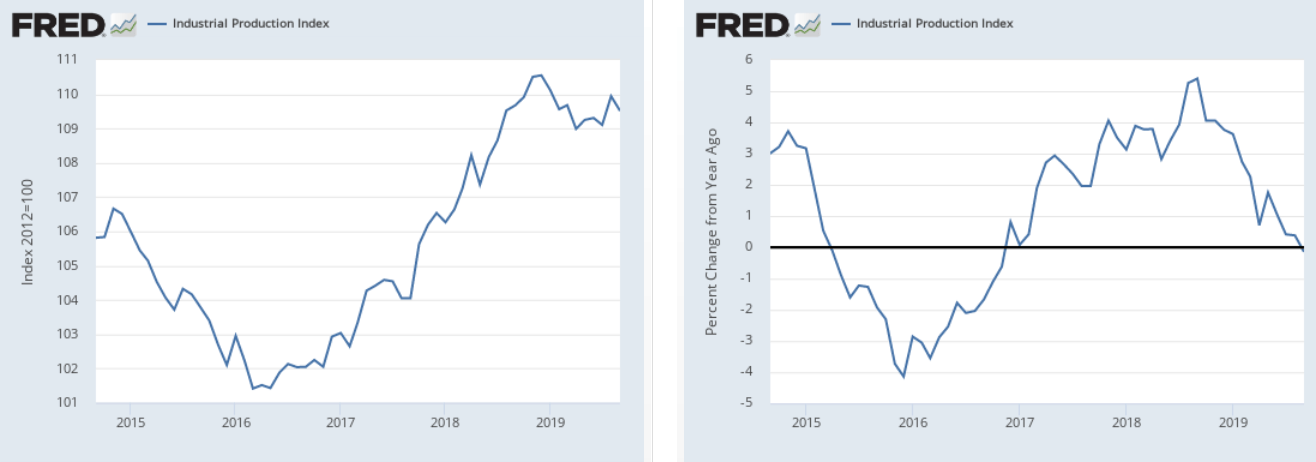
Industrial production is the only weak spot. Its growth is soft (left) while the Y/Y percentage increase just recently went negative (right).
Despite some softness in a section of the leading indicators, the coincidental data remains mostly positive.
