The economic calendar is normal, featuring housing data and retail sales. Everyone is also watching jobless claims for confirmation that employment is rebounding from the extremely depressed levels.
With so many economic and market crosscurrents, it is a good time for investors to align their expectations with the time frame of their plan.
Will the rebound trend continue? And for how long?
Last Week Recap
In my last installment of WTWA, I described the need for balance between economic and health concerns. There was some discussion of this specific topic and lots of talk emphasizing both sides. I expect this to be a continuing question for all – investors or not.
The Story in One Chart
I always start my personal review of the week by looking at a great chart. This week I am featuring Jill Mislinski’s version, an excellent combination of the most important information.
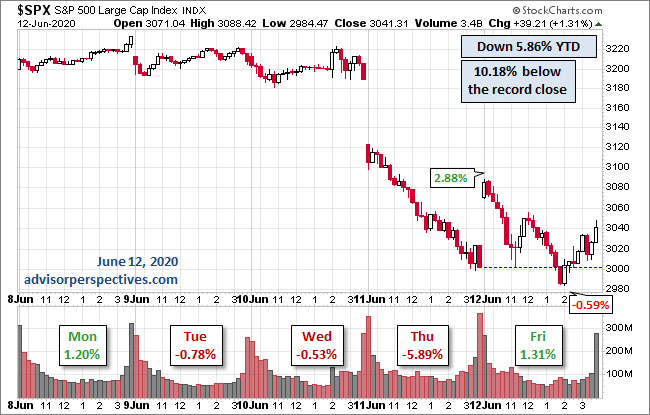
The market declined 4.8% on the week with a trading range (intra-week) of 8.3%. My weekly indicator snapshot (below) updates volatility along with other key market measures.
Personal Note
Yes, I am still supposed to be on vacation, but I have a few ideas to share. I think they are timely.
It is especially difficult to completely quit your work when you enjoy it and have not left home. I did change my schedule a bit to catch up on some projects. I even played bridge online a couple of times. This gave me a slightly different perspective on the daily news and helped to inspire today’s post.
The Week Ahead
We would all like to know the direction of the market in advance. Good luck with that! Second best is planning what to look for and how to react.
The Calendar
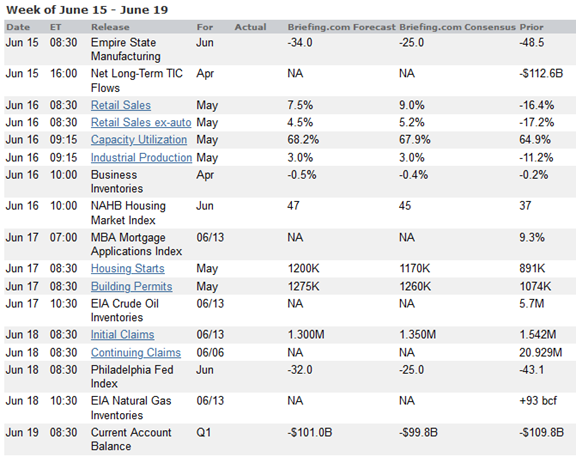
We have a normal economic calendar. Housing starts and building permits are both important, as is the May report on Retail Sales. Jobless claims, especially continuing claims, continue to be an early employment indicator.
Briefing.com has a good U.S. economic calendar for the week. Here are the main U.S. releases.
Next Week’s Theme
This is a good time to look ahead more than one week. The data show a rebound from the bottom in various indicators, including business and consumer optimism. The most important question for investors is how to interpret put this improvement in the context of their own investment time frame. In other words,
Can investors depend on the rebound trend?
Background
Commentary about the reason for stock moves was especially laughable this week. Thursday’s decline was assigned to the Fed press conference (mid-day on Wednesday) and COVID-19 worries. Friday’s early rebound, with no improvement in sight, supposedly reflected renewed optimism. As usual after a selloff, some celebrated the likely “rejuvenation” for equities because some of the “froth” had been removed from equity positioning.
A better way to summarize the explanations is to say the following:
- No one really knows what is causing specific short-term moves.
- Using one day to forecast what will happen next is more perilous than ever.
- As always, lack of knowledge does not stop anyone. Each move must be explained and market followers demand information about “how to position” for what happens next.
It is possible to gain some insight on these matters, but not for short-term prediction.
Some Propositions to Consider
Each of these is an idea with important investment implications. They are my conclusions from evidence I track. Each will be a future subject, but I hope readers will join me in thinking about them right now.
- Current economic optimism is overdone, relying on several elements.
- The Great Reopening will continue at the current pace.
- An early COVID-19 treatment and vaccine.
- A return to “normal” in a few months, the “V” shaped recovery.
- The pandemic may well lead to more business shutdowns and a longer recovery period.
- The number of states with increasing cases is growing. Some, like mine, have an alarming rate.
- The US has completed only 23 million tests with over 2 million cases. This is a high rate and still not many tests.
- Only five states meet the testing and tracing requirements needed to control COVID-19.
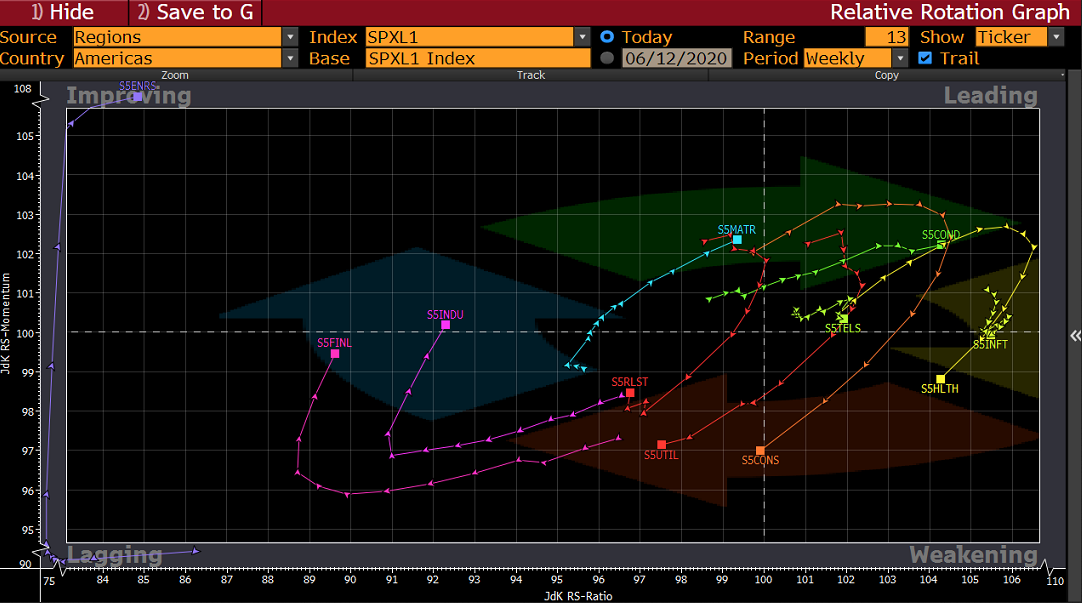
- Recent trading has provided a helpful preview of what we are likely to see in the weeks ahead. The Relative Rotation Graph shows sector behavior on two important axes – lagging/leading and improving/weakening. The sectors that have improved the most in this time of optimism are energy, financials, industrials, and materials. Is this a trend we can expect to continue right now? Or (as I conclude) a preview of a coming attraction.
Unhelpful Extrapolations and the Great Reset
This is an example of a dangerous extrapolation.
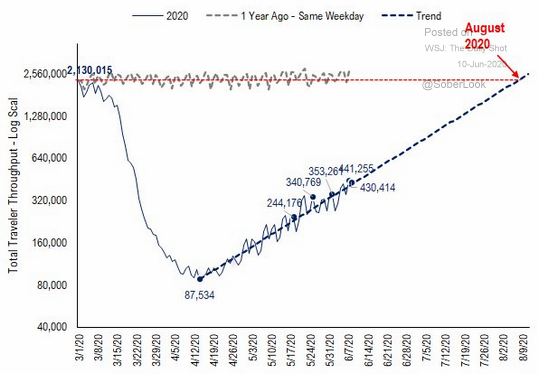
Air travel was the first topic in my Great Reset project. Those who have joined me got the report on the findings from the first Wisdom of Crowds survey and will soon get a report on the second. Based on what we learned, we would go “over” on the August 2020 projection. Way over!
There is great danger in looking at pictures of people crowding around without masks and concluding that all is well. As I often say: Insist on data. Accept no substitute. And then you still need to know how to analyze it.
Quant Corner and Risk Analysis
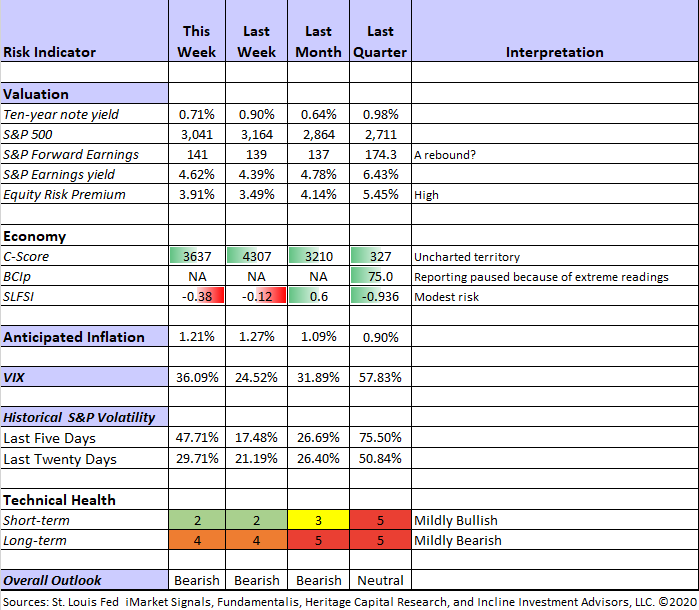
I have a rule for my investment clients. Think first about your risk. Only then should you consider possible rewards. I monitor many quantitative reports and highlight the best methods in this weekly update, featuring the Indicator Snapshot.
For a description of these sources, check here.
The technical picture has improved significantly over the last two weeks as we would expect after the recent market rebound. I include this as an indication of the trading environment. I continue my “Bearish” rating of the overall outlook for long-term investors. I have done additional selling over the last two weeks, building up the highest cash buffer I have had in many years.
The C-Score seems to have leveled off. It reflects is a dramatic change in underlying factors which normally provide important indications. This level is an extreme outlier that cannot readily be interpreted. Georg Vrba has paused the BCIp signal because of the extreme readings. It has done its job for now.
The Featured Sources:
Bob Dieli: Business cycle analysis via the “C Score”.
Brian Gilmartin: All things earnings, for the overall market as well as many individual companies.
Georg Vrba: Business cycle indicator and market timing tools.
David Moenning: Developer and “keeper” of the Indicator Wall.
Doug Short and Jill Mislinski: Regular updating of an array of indicators, including the very helpful Big Four.
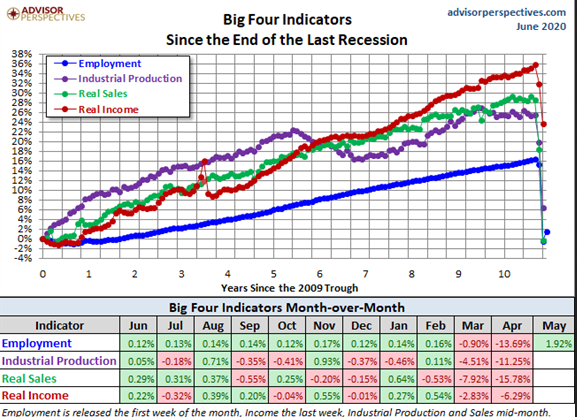
The NBER has, much more quickly than usual, determined the start of the current recession—February. As we can see, February was the peak for each series. The NBER did not wait for a “prolonged” period of decline, their stated definition. They explain as follows:
The usual definition of a recession involves “a decline in economic activity that lasts more than a few months.” However, in deciding whether to identify a recession, the committee weighs the depth of the contraction, its duration, and whether economic activity declined broadly across the economy (the diffusion of the downturn). The committee recognizes that the pandemic and the public health response have resulted in a downturn with different characteristics and dynamics than prior recessions. Nonetheless, it concluded that the unprecedented magnitude of the decline in employment and production, and its broad reach across the entire economy, warrants the designation of this episode as a recession, even if it turns out to be briefer than earlier contractions.
Final Thought
It is my hope that all readers, regardless of ideology or political affiliation, will benefit from my work on financial markets. Judging from the comments, some seem to believe that I have taken on a political agenda. Not so! It was not my idea that concern about the pandemic or wearing a mask would become some sort of political statement. Looking back at my posts, you will see that these were conclusions I reached long before the mask controversy. I wrote about them then, as I do now, because it is essential information for investors.
Current optimism, the speed of the recovery, and improvement in expected earnings depend upon some sort of balanced control of COVID-19. I make my investment inferences based upon the science and the various tracking sources I follow daily. I do not reach conclusions about science based upon statements of economists or politicians. I cannot change the policies selected, but I can and do change my portfolio to reflect scientific and economic reality.
As happens whenever there is a fresh crisis (Brexit, China, Trade issues, Recession forecasting), there is an inexhaustible supply of freshly minted “experts.”
Each investor much reach their own conclusion about confidence in recent trends. I remain bearish, continuing to lighten positions over the last two weeks. The stocks that have done the best in recent weeks are those that I am studying as post-recession candidates. I am also including my observations – still accurate—from two weeks ago.
I expect more bumps on the road to our destination. It is an interesting and important challenge: Find the best investments for the “other side.” I have seen many other investment articles this week that are trying to look ahead in this way. They are focused on what is working right now or what will work a month from now. This is a flawed approach in the absence of more information about the pandemic and the economy.
Here is a table from my last report to fellow Great Reset participants. They are all helping to collect data and ideas that we will help the entire investment community. Try your own ideas, asking where they might fit in the matrix below. For example, avoid A1 and embrace C1.

A Personal Request
One of my personal 2020 resolutions was even more emphasis on investor education – not just recommending stocks but learning how to find suitable choices. I have created a resource page where you can join my Great Reset group. You will get updates about what is being studied and can join in the process. There is no charge and no obligation, but I hope you will join in my Wisdom of Crowds surveys. I need more wise participants!
The results of our team effort will be published on a regular basis, so you will be joining me in contributing to a greater good.
