This week’s calendar features another relatively light week for data, a lot of politics, slow summer trading, and options expiration. Something has to fill all of that air time! Expect more Olympic coverage, political commentary, and light features. There will be the usual Fed chatter. To the extent that there is real market discussion, I am looking for a new topic: Have Oil Prices Lost Their Impact on Stocks?
Last Week
The important economic news was mixed as was the market reaction.
Theme Recap
In my last WTWA (two weeks ago), I predicted discussion about whether the earnings recession might end in Q3. I suggested we would need to fasten our seatbelts for a showdown on the economy and earnings, probably in quarter three. That might prove out, but we certainly did not need seatbelts last week! We had quiet summer trading with light news and plenty of people on vacation. CNBC interspersed Olympic coverage and even found time to have multiple segments featuring a sandwich on Friday.
Politics, global events, and competition intersected.
There was some support for my earnings thesis from our two key sources:
FactSet noted the distribution of earnings results by sector and the continuing overall beat rate.
Brian Gilmartin analyzed the forward curve for earnings, including some important implications.
The Story in One Chart Short
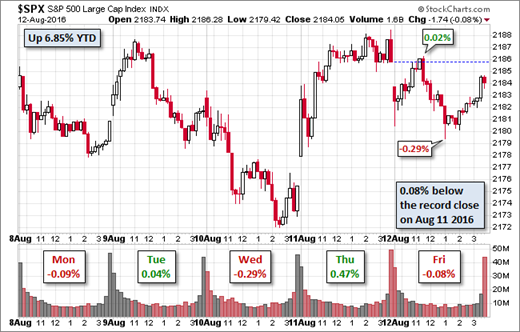
I always start my personal review of the week by looking at this great chart of the S&P 500 from Doug Short. The overall range is very narrow, with little overall change. Doug has a special knack for pulling together all of the relevant information. His charts save more than a thousand words! Read his entire post where he adds analysis and several other charts providing long-term perspective.
The News
Each week I break down events into good and bad. Often there is an “ugly” and on rare occasion something really good. My working definition of “good” has two components. The news must be market friendly and better than expectations. I avoid using my personal preferences in evaluating news – and you should, too!
The Good
- Gasoline prices are expected to move lower, perhaps as low as $1.92 by year’s end. (EIA forecast via Calculated Risk).
- Initial jobless claims remain low and even declined by 1000. (See Doug Short for charts and analysis).
- Mortgage rates are back at the lows, 3.375 for “flawless scenarios.” (Calculated Risk).
- The JOLTs report showed improved labor market conditions. Most sources are not covering this accurately. It is not an alternative method for estimating net job growth. It does show the trend in job openings, the structure of the labor market, and the voluntary quit rate. Nearly 3 million people each month are voluntarily leaving their jobs, double the number in 2009.
- Producer prices fell more than expected, 0.4%. Some are citing this as bad news. The bad news will come when stimulus overshoots.
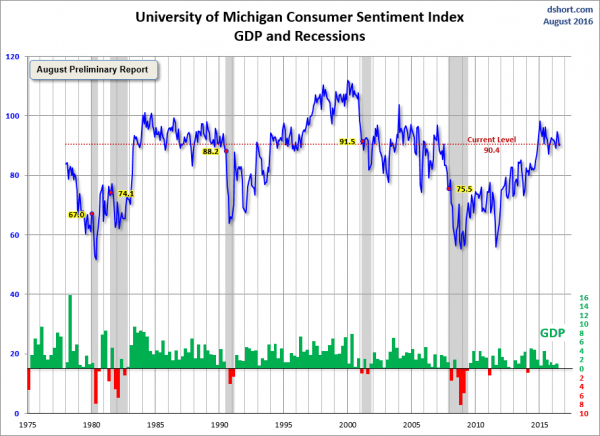
- Michigan sentiment remained strong, slightly beating expectations. Doug Short does the best analysis and has the most informative chart:
The Bad
- Railroad growth remains slow. Zacks explains that this has translated into lower earnings, partly because of the energy sector.
- Productivity fell 0.5%. Gains in productivity are essential for economic growth.
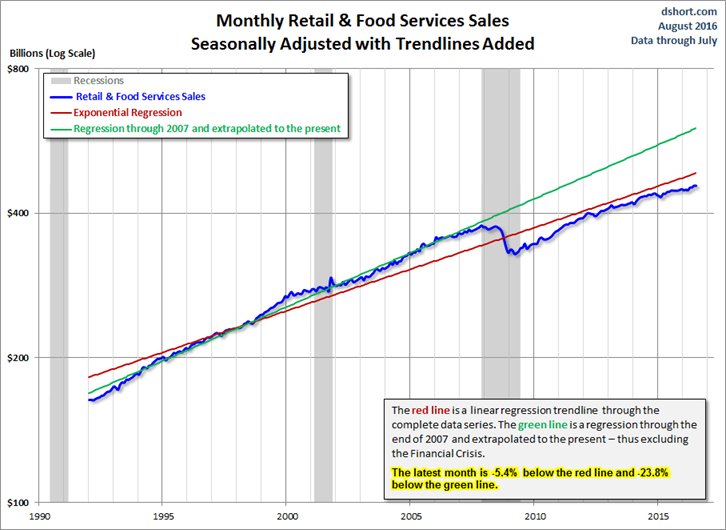
- Retail sales disappointed, with no growth month-over-month. It was also a significant miss of the 0.4% expected gain. Doug Short analyzes this disappointing report. As always, he provides helpful historical perspective, including the chart below. It seems to show a return to the pre-recession pace of growth, but without every closing the gap to the prior trend line.
The Ugly
Public retirement commitments. Robert Pozen, in a Brookings op-ed, highlights these costs, and the main reasons:
The unfunded liabilities for retiree healthcare for the 30 largest US cities exceeds $100bn, according to the Pew Charitable Trusts, a Philadelphia-based non-profit organisation. The unfunded liabilities for the 50 US states exceeds $500bn, according to Standard & Poor’s, the rating agency.
Retiree healthcare plans are uniquely American. They exist because the US has never offered universal healthcare before Medicare, the national social insurance programme, at age 65.
Many employees of cities and states retire between 50 and 55, so local governments usually provide them with highly subsidised healthcare between retirement and Medicare, and sometimes beyond.
For a more general analysis of the threat from retirement costs, see Mohamed A. El-Erian’s article on the “titanic risks.”
Noteworthy
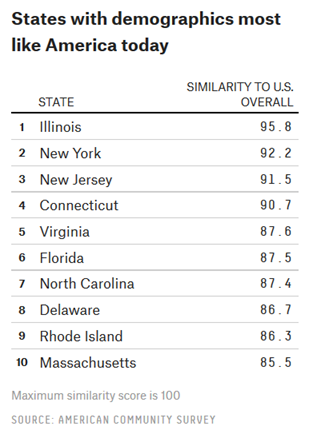
There is a lot of current discussion about the “typical” American community. FiveThirtyEight provides some interesting data on both cities and states. You will find the results interesting. Much to my surprise, I am living in the state with demographics closest to the country overall.
The Silver Bullet
I occasionally give the Silver Bullet award to someone who takes up an unpopular or thankless cause, doing the real work to demonstrate the facts. This week’s award goes to Justin Fox, writing at BloombergView. He takes on a popular myth that just won’t die – the manipulation of government statistics. Like Fox, I have some personal experience in working with the career civil servants who analyze data. The notion that they do whatever a (temporary) political leader instructs is very costly to investors who believe it. The article takes up various accusations and stories, with plenty of good discussion. Here is one key argument:
First, because I know a little bit about the people who put together our nation’s economic statistics. The Bureau of Labor Statistics, Bureau of Economic Analysis and Census Bureau are run on a day-to-day basis by career employees, not political appointees. Even the appointees are often career staffers who get promoted, and many have served under multiple administrations. When top statistics-agency officials do leave government, it’s often for jobs in academia. Credibility with peers is generally of far more value (economic and otherwise) to these people than anything a politician could do for them.
I would add that any shenanigans would be the basis for articles and books by those leaving the agencies.
The Week Ahead
We would all like to know the direction of the market in advance. Good luck with that! Second best is planning what to look for and how to react. That is the purpose of considering possible themes for the week ahead. You can make your own predictions in the comments.
The Calendar
We have another moderate week for economic data and the end of earnings season is near. While personally I watch everything, I highlight only the most important items in WTWA. It is important to focus.
The “A” List
- Building permits and housing starts (T). Permits are a good leading indicator.
- FOMC minutes (W). No one really expects any fresh news, but the punditry will find something.
- Leading indicators (Th). Still highly regarded by many, despite the various redefinitions. Continuing strength expected.
- Initial claims (Th). The best concurrent indicator for employment trends.
The “B” List
- Industrial production (T). Improvement expected in this lagging series, important to GDP.
- CPI (T). Inflation data remains a secondary indicator. It will take a few hot months to bring it to the fore.
- Philly Fed (Th). A rebound expected. This result has earned growing respect.
- Crude inventories (W). Often has a significant impact on oil markets, a focal point for traders of everything.
There is plenty of FedSpeak for those who have been missing that. Options expiration on Friday may delay the exodus to the beach for some.
Next Week’s Theme
Quiet calendars and slow trading offer time for collective introspection. There will be plenty of political discussion, tempting investors to draw unwarranted conclusions about their money. I have noted a new theme in the discussions of the Pundit in Chief and the Senior Stock Trader: Some head-shaking over the daily divergences between oil and stock prices. I might be a little early with this expectation, but it is worth thinking about. Expect the pundits to be wondering:
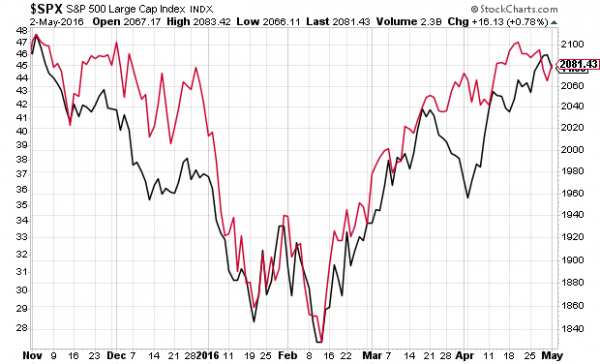
Has the Correlation between Oil and Stock Prices Broken Down?
Eddy Elfenbein noted the breakdown. I am always encouraged when he reports observations consistent with my own. Here is his chart:
This week’s problem has two parts:
- What will happen to oil prices?
- Will stocks follow?
For now, let’s stick to the first question, where there are plenty of opinions:
- Oil supply and demand is now in rough balance. (“Davidson” and some other experts).
- Oil is going lower – back below $30. There is still a glut and higher prices reflect a short squeeze.
- Oil is going much higher. The oil glut is smaller than expected leading to a target of $80. Current trading reflects only momentum, not fundamentals.
….and many similar opinions on all sides.
As always, I’ll have a few ideas to add in the conclusion.
Quant Corner
We follow some regular great sources and also the best insights from each week.
Risk Analysis
Whether you are a trader or an investor, you need to understand risk. Risk first, rewards second. I monitor many quantitative reports and highlight the best methods in this weekly update.
The Indicator Snapshot
The Featured Sources:
Brian Gilmartin: Analysis of expected earnings for the overall market as well as coverage of many individual companies. This week he expresses more confidence about growth in earnings.
Bob Dieli: The “C Score” which is a weekly estimate of his Enhanced Aggregate Spread (the most accurate real-time recession forecasting method over the last few decades). His subscribers get Monthly reports including both an economic overview of the economy and employment.
The recession odds (in nine months) have nudged closer to 10%.
Holmes: Our cautious and clever watchdog, who sniffs out opportunity like a great detective, but emphasizes guarding assets.
Doug Short: The Big Four Update, the World Markets Weekend Update (and much more).
The ECRI has been dropped from our weekly update. It was not so much because of the bad call in 2011, but the stubborn adherence to this position despite plenty of evidence to the contrary. Those interested can still follow them via Doug Short and Jill Mislinski. The ECRI commentary remains relentlessly bearish despite the upturn in their own index.
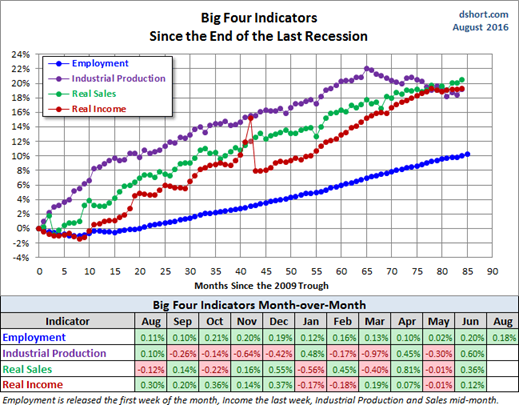
It is time for another update of Doug Short’s Big Four. The start of another recession would be marked by a peak and significant decline in these indicators. Most investors should take a frequent look at this chart instead of the headlines in the financial press!
Georg Vrba: The Business Cycle Indicator, and much more. Check out his site for an array of interesting methods. Georg regularly analyzes Bob Dieli’s enhanced aggregate spread, considering when it might first give a recession signal. Georg thinks it is still a year away. It is interesting to watch this approach along with our weekly monitoring of the C-Score.
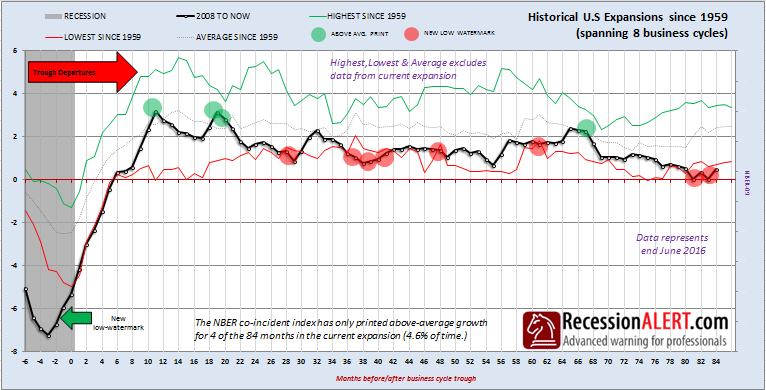
RecessionAlert: Many strong quantitative indicators for both economic and market analysis. While we feature his recession analysis, Dwaine also has a number of interesting approaches to asset allocation. This week Dwaine has his own interpretation of the “Big Four” indicators – a recent narrow miss. Despite this, he concludes:
To conclude, looking at the individual co-incident monthly data used by the NBER shows a far more pessimistic view currently than when looking at a syndrome of conditions. But the co-incident data in this particular indicator and the recession probabilities we are registering are not as bullish as the employment data would have you think. In fact, taking our proprietary implementation of the Big-4 index, and comparing it to the last 8 expansions, shows just how meek this recovery has been:
How to Use WTWA
In this series I share my preparation for the coming week. I write each post as if I were speaking directly to one of my clients. For most readers, they can just “listen in.” If you are unhappy with your current investment approach, we will be happy to talk with you. I start with a specific assessment of your personal situation. There is no rush. Each client is different, so I have six different programs ranging from very conservative bond ladders to very aggressive trading programs. A key question:
Are you preserving wealth, or like most of us, do you need to create more wealth?
My objective is to help all readers, so I provide a number of free resources. Just write to info at newarc dot com. We will send whatever you request. We never share your email address with others, and send only what you seek. (Like you, we hate spam!) Free reports include the following:
- Understanding Risk – what we all should know.
- Income investing – better yield than the standard dividend portfolio, and also less risk.
- Holmes – the top artificial intelligence techniques in action.
- Why 2016 could be the Year for Value Stocks – finding cheap stocks based on long-term earnings.
You can also check out my website for Tips for Individual Investors, and a discussion of the biggest market fears. (I welcome questions or suggestions for new topics.)
Best Advice for the Week Ahead
The right move often depends on your time horizon. Are you a trader or an investor?
Insight for Traders
We consider both our models and also the best advice from sources we follow.
Felix and Holmes
We are continuing with a bullish market forecast. Felix is fully invested, including several aggressive sectors. The more cautious Holmes is now also fully invested.
Top Trading Advice
Traders are worried about the next two months, notes Steven M. Sears (Barron’s). Trading desk chatter about Chair Yellen’s upcoming Jackson Hole speech, a possible rate hike, and mean-reverting behavior in volatility. This has them buying call options on the VIX, popularly known as the fear index. Should you join this trade? I am not making a recommendation, but merely raising an idea for consideration. I do not share the concern about the impact of a rate hike. I also note that several of those quoted are selling derivatives.
Dr. Brett asks, Can Successful Trading Be Taught? He answers “yes” and explains how.
In another great post he explains how to “train your brain.”
We should all seek information from people with the right expertise and the right experience. What could be better than a clinical psychologist, a teacher, a coach of traders, and decades of personal trading experience? Every trader I know would benefit from Brett’s books as well as his blog.
Insight for Investors
Investors have a longer time horizon. The best moves frequently involve taking advantage of trading volatility!
Best of the Week
If I had to pick a single most important source for investors to read this week it would be some ideas that “keep on giving.” This contradicts the page view theory of posting: Look for “actionable investment advice.”
How to Read Financial News: Tips from Portfolio Managers is worth reading and re-reading. Robert J. Martorana is an insightful author and organizer. He was the editor (I called it ‘ringmaster”) when I wrote for TheStreet.com’s Real Money site. He has organized regular conference calls among advisors, bloggers, and investment managers who all have great ideas and strong credentials. Recently he took some of the calls and turned them into a first-rate educational piece about reading financial news. I am delighted to be included. I hope others find the ideas as useful as I do. If it is popular, perhaps Rob will do more of these.
Another good post on this theme is from Morgan Housel, who describes things that he is “pretty sure about.” It is a great list. My favorites are the following:
Recessions and bear markets are very easy to predict, except for the timing, cause, magnitude, duration, location, and policy response.
Look at today’s five largest companies in the world. Fifteen years ago, one of them didn’t exist, one was a tiny start-up, one was a belittled relic of the dot-com bust, another was fighting to stay relevant after flirting with bankruptcy a few years before. I suspect the next 15 years will be even more extreme.
If you tell people what they want to hear, you can be wrong indefinitely without penalty. This explains the careers of many pundits.
Stock Ideas
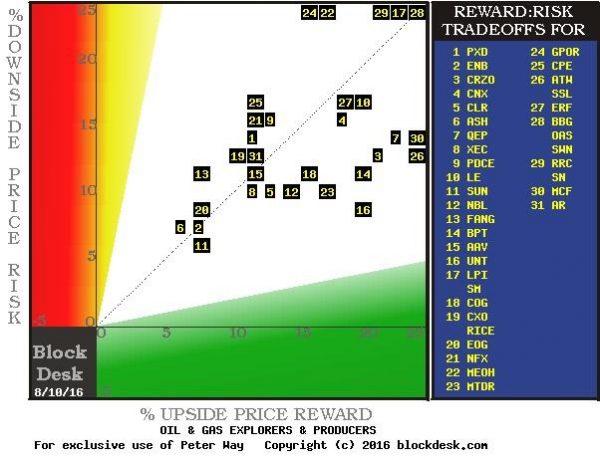
Oil exploration stocks? Peter Way has an interesting approach to analyzing the upside/downside risk of this sector.
It is not too late to buy dividend stocks. Philip Van Doorn explains how to sort through the risks.
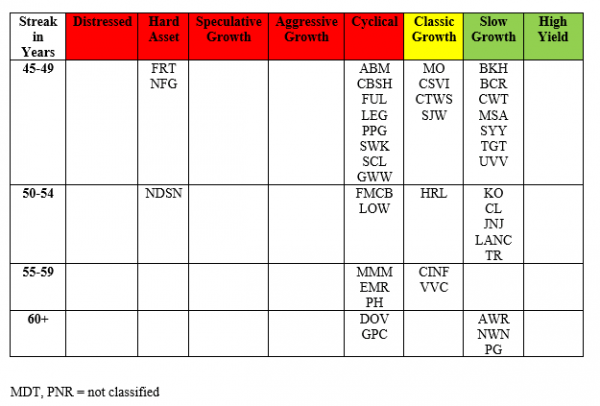
David Van Knapp has a “periodic table” of dividend champions. You need to read the entire post to appreciate this. Here is part of it:
Holmes will begin contributing an idea each week, a stock we bought for clients a few days ago. I will mention it here and Holmes will also post it each Friday at Scutify.com. While we cannot verify the suitability of specific stocks for everyone who is a reader, the ideas may be a starting point for your own research. Holmes may exit a position at any time, and I am not going to do a special post on each occasion. If you want this information, just sign up via holmes at newarc dot com and you will get email updates about exits. This week’s Holmes pick is Eastman Chemical (NYSE:EMN).
Market Overview and Outlook
The consensus market forecast is now Dow 20,000 (sort of). Victor Reklaitis explains at MarketWatch.
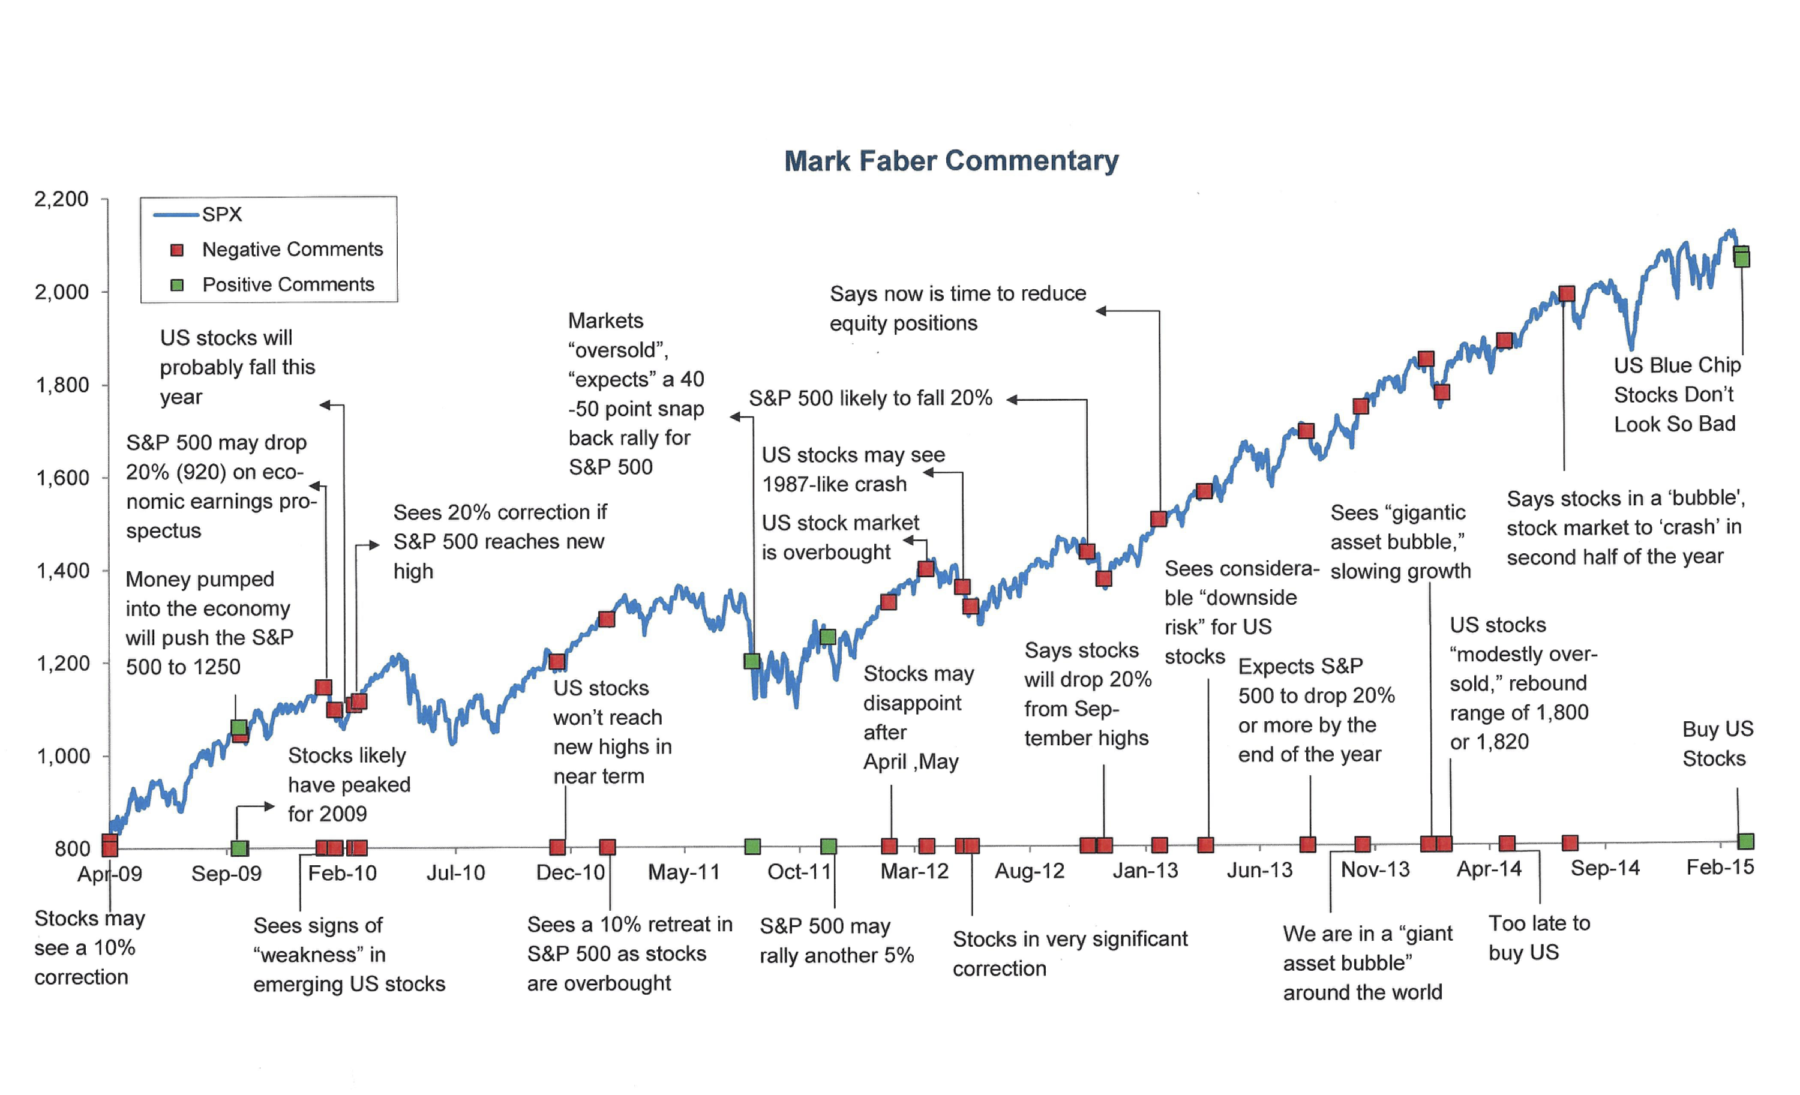
Should you hedge against a crash? Marc Faber is (once again) predicting a 50% market crash. Some are outbidding him by calling for 80%! Barry Ritholtz takes up this topic providing a list of his past predictions and this chart:
Should you hedge against Zika? Josh Brown, expressing realistic concern about the virus, emphasizes the need to separate such events from your investment decisions.
Michael Harris suggests, “The frequency of articles in the financial media and blogosphere with calls for a stock market collapse is often a good indicator of a bullish market”. Read the full post for discussion and a chart of events this year.
Should you sell the market high? HORAN Capital Advisors does a complete analysis.
Personal Finance
Professional investors and traders have been making Abnormal Returns a daily stop for over ten years. The average investor should make time (even if not able to read AR every day as I do) for a weekly trip on Wednesday. Tadas always has first-rate links for investors in his weekly special edition. There are several great choices worth reading, but my favorite is the NYT article from Ron Lieber, explaining how to maintain your 401(k) – ignore it! You can do better if you follow the risk indicators on WTWA, but most people who closely follow their statements buy and sell at exactly the wrong times.
Election Effects
Expect many more articles on the impact of the election and what stocks you should own. I am sticking with my year-long viewpoint: This is all overdone. The new president, whoever is elected, will face a struggle in passing an innovative agenda. No such analysis can be complete without considering the likely makeup of Congress – and that is just for starters. Barron’s has a cover story featuring a likely Clinton election and analyzing the policies. The NYT analyzes the difference in tax policies.
Value Stocks
If you missed my special post on this topic, addressing the “value trap” question, please take a look.
Watch out for….
Surprises in ETF trading costs. Chris Dieterich (Barron’s) notes that the explosive growth in choices has led to many niche funds without liquidity. He cites some examples where the bid-ask spread imposes a higher cost than the management fee!
Utility stocks. James Picerno wonders whether the “wobbly rally” signals a bubble.
Fancy ideas now aimed at the “little guy.” Some of the big guys are cutting allocations.
Final Thoughts
The correlation between oil prices and stocks never made any sense. Some traders prefer commodity prices as an economic indicator. They are skeptical of the official data. The fact that oil prices represented a supply story rather than weak demand did not stop many from hitting the recession panic button. HFT algo’s picked up something that was working, and a lot of hot money started following this trade. If you were a trader, you had to take notice. On some days CNBC would view oil traders who said they were watching stocks, as well as stock traders who were watching oil. When a trade is working, you should not go too deeply into the reasons.
Investors got the chance to buy some great stocks at lower prices.
Fundamentally, lower gas prices are good. Past price surges were frequently described as a consumer tax with no corresponding benefit. Whether people spent or saved the extra cash, it had a positive effect. Since all transportation costs were lower, everyone was helped, not just drivers, although the effects are difficult to calculate.
When the market responded negatively to lower prices many started reaching for explanations. Attention turned to those living and working in oil production areas, as well as banks making loans to them. This was true enough and easier to see than the larger, but diverse effect on consumers.
A New Chapter?
With the rebound in oil prices, will the punditry cite this as a reason for higher stock prices? I am not counting on that, but two months ago I highlighted the idea that oil prices might have hit a “sweet spot.” Energy company earnings will be better. The potential for higher production places a brake on price spikes. It provides a healthy environment for the economy and the stock market.
The oil/stock relationship may be fading, but count on the trading world to find something new!
Explaining small daily moves in the market averages is like analyzing why a snowflake fell on you rather than the person walking next to you. The many words and hours spent doing this are worse than worthless. The process creates a false sense of logic and order which may well cause mistakes in future decisions.

