We have a huge economic calendar, including all of the major reports. Of special interest is employment, with the official BLS data on Friday and the ADP private payrolls on Wednesday. ISM manufacturing will lead off the week with ISM services soon following.
Oh. There is also an election and a raft of earnings reports.
There will be much more clarity for investors in a few days. Meanwhile, everything you see or read offers a prediction. I do not mind a careful, data-based forecast that results in odds. Instead, most are providing a narrative comparing the current investment climate to some other occasion. Be careful of that.
Do not be seduced by shallow analogies.
Such stories are easy to write but provide little evidentiary value.
Last Week Summary
In my last installment of WTWA, I urged readers to think descriptively rather than proscriptively. There was no sign of that in financial media, where every story drifts into an opinion about what will happen.
Key Charts
I always start my personal review of the week by looking at some great charts. This provides a foundation for considering news and events. Whether or not we agree with Mr. Market, it is wise to know his current mood.
Market Story
This week I am featuring Jill Mislinski’s chart of the market week. Her approach combines several key variables in a single readable format.
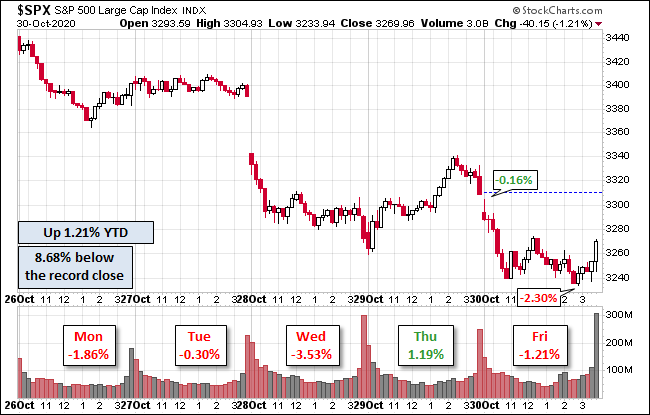
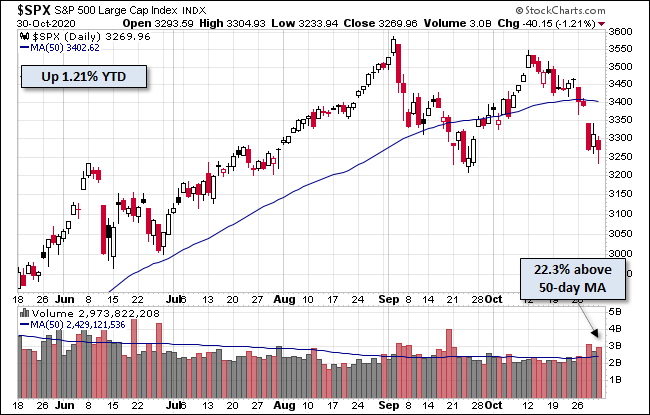
The S&P 500 broke the 50-day MA as part of the decline. The index held a little above the September lows.
Sector Trends
Sector movement is another important clue to market trends.
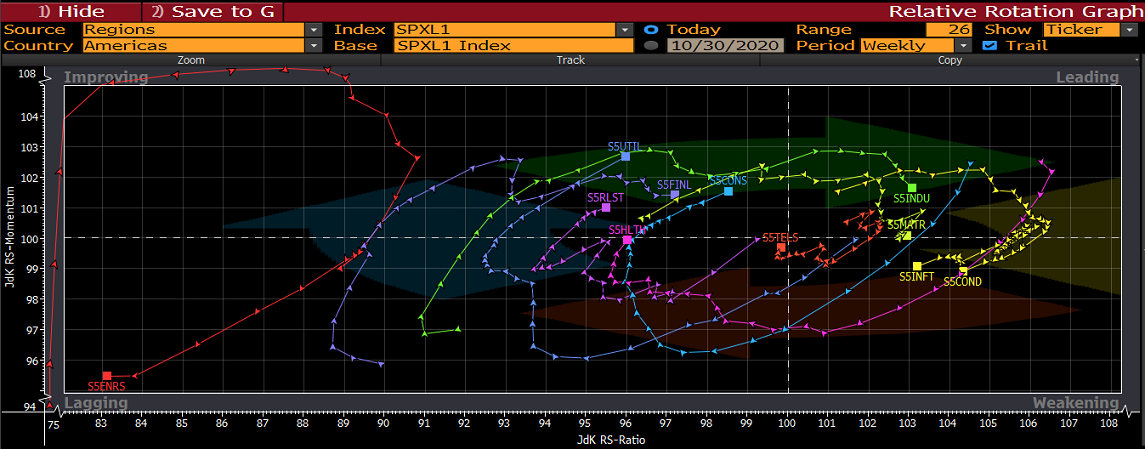
Once again, Juan Luque provides us with some words of wisdom from the Incline trading desk:
The S&P 500 Index was down 5.64% this week with all sectors in the red. The increase in Coronavirus infections in the U.S. and in the world is affecting how investors feel about economic recovery and future performance of companies. The long-term trends remain with the same protagonists–Industrials in the leading quadrant, Consumer Staples, Financials, and Utilities strong in the improving sector, and Energy in the red. The Health Care sector has gained some momentum and has started to move towards the improving sector.
Comment
The market lost 5.6% for the week with a trading range of only 7.2%. A late rally on Friday afternoon improved the result, but it still was a poor week in a poor month. You can review trends in actual and implied volatility in my Indicator Snapshot, featured in the Quant Corner.
Personal
Last week I wrote about my “travel” plans this week and said that I would probably not post WTWA. I felt that the week was dramatic enough to deserve some comment, thus this abbreviated post. The conference attendees (the National Association of Active Investment Managers) were pretty bearish. They are sharp money managers with an array of technical and fundamental methods. There were many ideas shared and great speakers at this excellent meeting.
Tuesday, Nov 3rd, I will join leading financial journalist Chuck Jaffe on his Money Life Show. My segment is scheduled for 11 AM EST. I will be discussing my current market analysis, the election, and a few stocks from listeners.
Last but certainly not least, thanks to Investopedia for once again selecting me as one of the Top 100 Financial Advisors of 2020. As they write:
The Investopedia 100 celebrates financial advisors who are making significant contributions to critical conversations about financial literacy, investing strategies, life-stage planning and wealth management. With more than 100,000 independent financial advisors in the U.S., the Investopedia 100 spotlights the country’s most engaged, influential, and educational advisors.
The News Overview
Each week I break down events into good and bad. For our purposes, “good” has two components. The news must be market friendly and better than expectations. I avoid using my personal preferences in evaluating news – and you should, too!
Good
- Durable goods orders for September increased 1.9% beating expectations of 0.7% and August’s 0.4%.
- Personal income for September increased 0.9%, beating expectations of 0.3% and trouncing the prior decline of 2.5%.
- Personal spending increased 1.4% beating expectations for a 1% gain. 1% was also the August gain.
- Consumer confidence was slightly higher on the Michigan survey and slightly lower on the Conference Board version.
- Earnings results are setting records versus expectations. (FactSet). Forward earnings estimates also show strength. (Brian Gilmartin).
Bad
- A fiscal stimulus compromise was not achieved.
- Coronavirus cases have increased throughout the U.S. The rise is dramatic in some states and in parts of Europe, where lockdowns are either contemplated or already in place.
- Good earnings combined with a non-committal outlook has not been a winning combination for stocks that have reported earnings.
Calendar
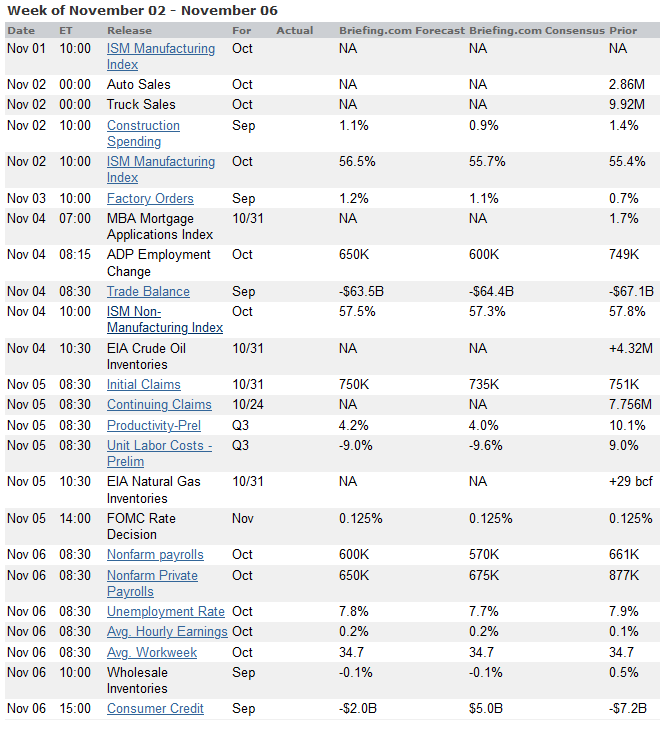
We have a big week for economic data featuring the monthly employment report. There is also employment news from ADP and the regular data on jobless claims. The ISM manufacturing and non-manufacturing reports will be closely watched. The FOMC rate announcement, two days after the election, will also be closely watched.
126 of the S&P 500 companies will report earnings.
This is all in the shadow of the election result and aftermath.
Briefing.com has an excellent weekly calendar and many other useful features for subscribers.
Theme and comment
I expect the election to dominate the news in the week ahead. Investment stories will analyze how the results should be interpreted and what it will mean for markets.
I have nothing more to say on this topic, but my posts from the last few weeks still read well.
Slipping away from Mrs. OldProf (who objects when I break my “day off” promises), I want to point out a trap that I am seeing repeatedly in news stories. Journalists and pundits alike love to make comparisons. They are easy to find (or cherry pick) and more engaging the data. This leads me to a warning:
Don’t bite. Do not be convinced by a single past example. The narrative of an analogy can be seductive, which makes it more dangerous.
Here are a few examples:
- This election is just like 2016.
- The pre-election market behavior is like 2016.
- The last time there was a strong rebound, it continued for years.
- It is right to buy when the VIX is high.
Here are a few sound conclusions:
- Implied option volatility is at an extreme. It is focused on this week, as I showed in this week’s Yield Boosting Corner Zoom session. Options in Bristol-Myers Squibb (NYSE:BMY) have an implied volatility of 50 the upcoming week, but only 40 when you include the following two weeks. This is a good read on the market opinion for a possible big move.
- The instant analysis of the election result will be wrong. Pundits always act as if the winner has superpowers. Policies require coalition building in the face of obstacles. This is true even if one party controls both Congress and the Presidency.
- There will be plenty of time to analyze results and reach sound decisions with more clarity.
Quant Corner
I have a rule for my investment clients. Think first about your risk. Only then should you consider possible rewards. I monitor many quantitative reports and highlight the best methods in this weekly update, featuring the Indicator Snapshot.
Indicators
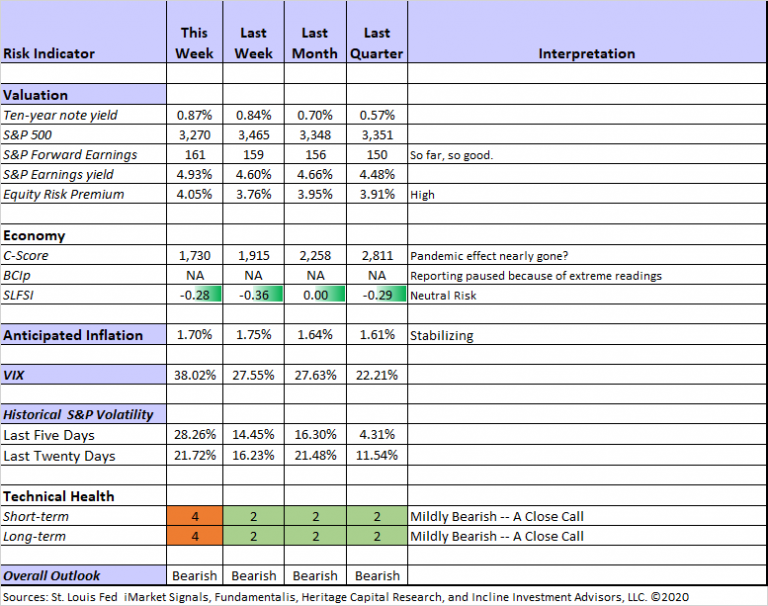
For a description of these sources, check here.
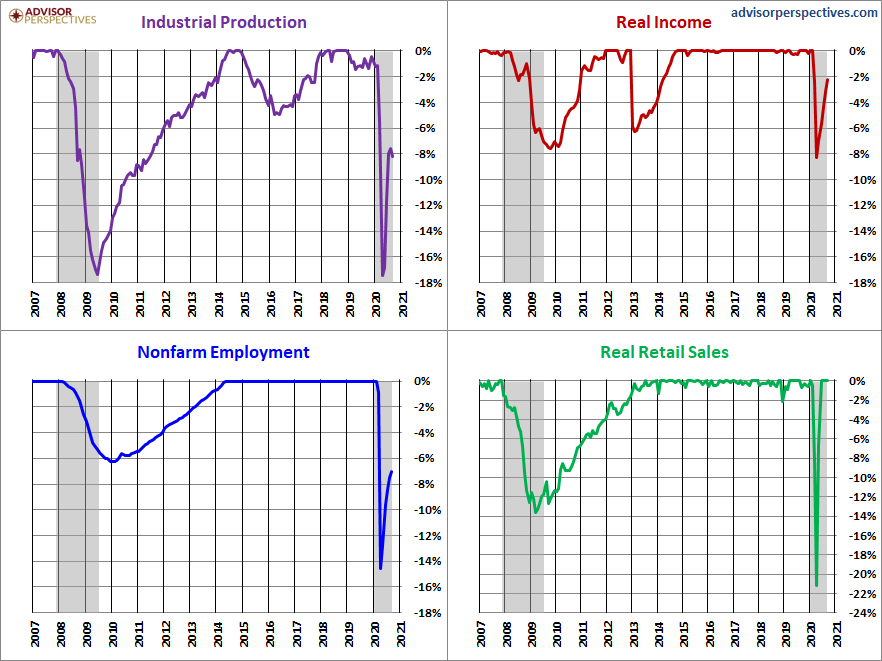
With the rest of the September economic data in place, let us review the Big Four from Jill Mislinski.
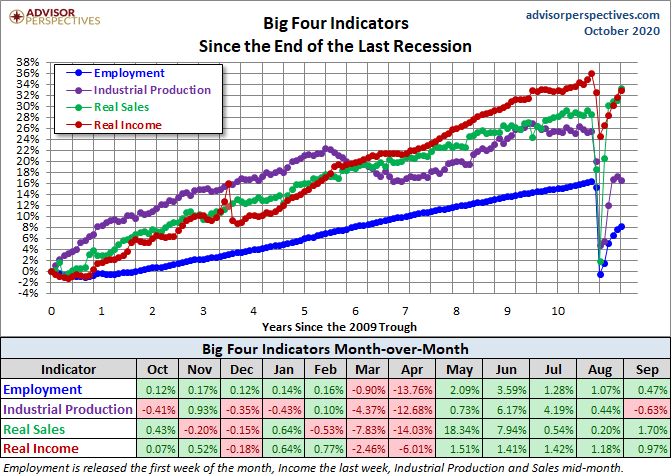
There is plenty of green, but these charts show how far we are from resuming the past trend.
Comment
Technical measures broke various support levels last week, accounting for the downgrade in that rating.
My continued bearish posture for long-term investors is based upon both valuation and fears about the continuing recession.
My Portfolios
I continue to maintain higher than normal cash levels as a cushion against the continuing recession. It is possible to do this and still meet your goals provided you do not make extreme decisions. I am doing well in all stock portfolios, mostly by selecting less risky stocks. I did some light buying last week, and I sold volatility.
Thinking about Risk – and Future Opportunities
Take a little time to review your holdings and ask how they would do under various scenarios. My recent white paper on this topic provides a method for finding and measuring risk. It provides solid information that does not fit well in my regular posts. I also urge you to join my Great Reset research group where we are discovering the best post-recession investments. My immediate focus will be on the election effects.
There is no charge and no obligation for either the Portfolio Risk paper or the Great Reset Group. Just make your request at my resource page.
